Tag: Japan

  • Demographics and Population Projections of Japan

    Demographics and Population Projections of Japan


    INTRODUCTION


    Japan gets special consideration because it is further along the demographics declining population curve than any other large country. It has the oldest population (highest average age) in the world. It has one of the world’s lowest birth rates. Unless there are major changes in healthcare technology, immigration, public policy, and birth rates, most industrialized countries will follow Japan down the path of declining and aging populations, and smaller labor forces.


    Japan’s demographics and immigration have become major political issues. In the July 2025 elections, two right-wing parties made substantial gains against the long-ruling Liberal Democracy Party (LDP). Two of their main issues were the rapid rise of immigration and the repeal of a 10% consumption tax used to pay for the rising costs of supporting the aged. Both parties appealed to young voters. The LDP has nominated a candidate for prime minister who also takes a hard line on immigration.


    PROJECTIONS


    Japan’s current (2024) population is around 122 million people. This is the 15th year of population decline, down from a high of 128 million. The yearly decreases so far have been small, both in numbers and as a percent of the total. This is expected to continue until 2030. Then population decreases are expected to accelerate to a population of 104 million in 2050 and 87 million in 2070. At the end of the century, Japan’s population is projected to be 60-65 million people, about half its current size.


    The high dependency ratio (the number of elderly divided by the number in working age groups – 46%, the highest in the world) is expected to rise to about 70% in 2050, about 75% in 2070 and about 80% in 2100. Not everyone in the working age group is in the labor force. Thus, by 2100, there will be almost one Japanese over 65 for every employee in the labor force. Government budgets will find it increasingly difficult to raise tax revenue to meet the rising social costs of an aging society. 


    Figures are from The Economist, “Japan’s economic troubles offer a glimpse of a sobering future,” December 5, 2019.


    Japan has one of the lowest birth rates in the world at 1.2 in 2023. Also in 2023, the number of deaths was twice the number of births.

    Japan has the world’s oldest population, both as measured as average age and with the highest percent of residents over 65. 


    LABOR FORCE AND FUTURE ECONOMIC GROWTH


    Over the past 20 years, Japan’s working-age population has declined by more than 10 million workers, about 14% of the workforce. The current labor force (age group 15-64) is 73 million. By 2050, Japan’s working-age population is expected to fall to 53 million. (U.N. World Population Prospects 2022) In 2100, the labor force age group is expected to be about 32 million, about 40 million less than the current size. 


    Japan’s 65 and older population of 37 million is about 25% of the total. As early as 2050, about 40% of the adults will be over 65. Surprisingly, the number of Japan’s elderly is already near the projected maximum.


    Current statistics from Japan’s Internal Affairs Ministry, July 24, 2024.


    Projections from:

    Statistica, ”Forecast of the total population in Japan from 2023 to 2120,” November, 2023. https://www.statista.com/statistics/607427/japan-forecast-total-population/


    Statistica, “Forecast of the total population in Japan from 2023 to 2120, by age group,” November 2023. https://www.statista.com/statistics/612575/japan-population-age-group/


    Japan admitted few immigrant workers in the past to increase its labor force but the yearly number has been rising, up 330,000 in 2023.  In 2025, there were 3.8 million immigrant workers in Japan. This was over 3% of its labor force. Most are on short-term or work visas (Japan calls them “trainees”) and are not expected to stay. Japan rejects 99% of applications for asylum. Under current law, it is very difficult for immigrants to become citizens or permanent residents.


    In Japan, the labor force and the population are decreasing at about 1% per year. Productivity is increasing at about 1.3% per year, giving economic growth of 0.3% per year. But because of decreasing population, output per person is increasing at about 1.3% per year, or about the same as in the U.S. Growth rates are much lower but the increase in output per person is about the same. This may be one reason there is very little call for any economic, political or social reform in Japan despite almost no economic growth. And this has been going on since the 1990s. But the demographic trends may increase tensions between younger workers and retirees.


    Japan’s real GDP has been basically stagnant over the last 25 years. Without structural changes to Japan’s political and economic system, Japan’s real GDP in the future will grow slowly at best and eventually decline along with its labor force and population.


    As the size of the labor force decreases at a higher rate, and faster than the older age group, it is likely that output per capita will start to decrease.


    THE STRUCTURE OF THE JAPANESE LABOR MARKET


    The number of employed Japanese has not fallen as much as the decrease in the number of people in the prime labor force age groups. Until recently, this has been due to the increased participation rates of women in the labor force. But the high current female participation rate suggests little if any increase in workers from this past trend.


    While female employment rates are high, over 50% of female employees hold part-time positions as seasonal or temporary workers. This means they are not covered under lifetime employment or job security guarantees. Many full-time female workers are classified as temporary to avoid giving them lifetime employment protection. As a group, female workers are probably underemployed.


    As in other countries, employment does not stop at retirement age.

    In Japan, as in the United States, many people over retirement ages own or work in small businesses. So the numbers in the prime working ages do not coincide with the number of employees. 


    Japan’s retirement age is 60, although older workers can request to work until they are 65. Many retired Japanese buy or work in small, local businesses such as noodle shops, small grocery stores or other kinds of small stores to supplement public or private pensions. Over 1/2 of Japanese aged 65-69 and more than 1/3 aged 70-75 are employed to supplement small retirement benefits. The percent falls to 12% for over-75. There are about 22 million in the over-75 category. Over-75s in Japan is about the average of over-65s in industrialized countries.


        The Economist, “Japan’s 2025 Problem,” in The World Ahead

        2025, 38.

    As more people work beyond retirement age, countries will have to reassess retirement benefits and taxes on the elderly.


    The Japanese government projects that social-security costs, including pensions, will increase by 60% between 2025 and 2040. A change in the pension system, probably to increase pensions, is scheduled for 2025.


    Over 1/3 of the total foreign workers are from Vietnam, China or the Philippines. They tend to work in manufacturing or construction. Many recent immigrants come from Nepal or Myanmar. There is a lack of Korean workers. Japan is now attempting to attract foreign employees with technical skills or higher education.


    About half of Japanese employees are between 45 and 54 years old. This indicates that about half of Japan’s current labor force could retire in the next 20 years.


    Japan’s unemployment rate is low, between 2% and 3%. There is much discussion about companies finding it hard to hire as many employees as they would like. Government ministries are concerned about a national labor shortage that can only get worse. This would probably contribute to low economic growth in the future.


    A peculiarity about the Japanese labor market. The definition of unemployed is more restrictive than in other countries. No one knows what the unemployment rate would be if Japan used the American definition.


    The low unemployment rate, a slight decrease in the number of employed Japanese and the labor shortage, combined with higher inflation rates, are putting pressure on wage rates. In 2023, the average wage increase was around 5%, which is high for Japan. Wage increases might continue.


    The overall impression is that the Japanese labor market is not very flexible and that workers tend to be less mobile than they might be under different rules and regulations. This may also be obstacle to raising labor productivity and a barrier to higher economic growth in the future. 


    JAPAN AS A MODEL – OLD AND RICH


    Japan might serve as a model for future demographics of other countries in two different ways. One is as a model for countries with a high per capita income. The other is for countries that have a lower, often much lower, per capita income but are aging rapidly. This includes China and most of the countries of east and southeast Asia. They will grow old before they grow rich.


    Most of the countries in east Asia, including China, have a birthrate equal to or lower than Japan’s. They are on a similar demographic curve, only a little behind. The difference is that Japan is much richer, with a substantially higher income per capita. If managed right, Japan has the resources to pay for adequate levels of support for its increasing numbers of senior citizens. The other countries will age before they achieve per capita incomes anywhere near Japan. This will probably put a greater strain on their public finances and they will not be able to provide adequate health and services support for their aging populations.


    In economic theory, deficit-financed government spending is expected to make up for weak private consumption and domestic investment spending to ward off deflation and recession. In the future environment, however, demographics can overcome aggressive monetary and fiscal policy to stimulate economic growth. These policies have already failed in Japan. Zero interest rates on public debt, large budget deficits, high levels of government infrastructure spending and the highest national debt/GDP ratio in the world have not improved very low economic growth. A current (2025) rise in inflation rates and wages will put further strain on the Japanese economy.


    The large budget deficits are financed by borrowing much of the country’s household savings at near zero interest rates. Japan’s central bank has just raised its equivalent to the Fed funds rate to 0.25%. Other central bankers are not impressed.


    There is no chance of balanced budgets in the future. A rise in interest rates would make Japan’s financial problems worse.


    Domestic demand is weak even though unemployment is low. Rather than raise wages, Japanese companies export manufacturing to other countries, especially China and other Asian countries. The is accompanied by substantial investment outside of Japan.


    Japanese companies are starting to substitute robots for workers in Japan. Japan expects to greatly increase its use of robots, partly in health care services.


    An aging population contributes to social and political resistance to structural reforms. The dominant political party substitutes government spending and subsidies, combined with appeals to Japanese traditions, for reforms that might threaten social stability. But there is a political backlash among young voters against the dominant party that they feel represents the interest of older voters.


    All of this is before the economic costs of climate change and global warming. Japan in the past has suffered from devastating earthquakes. A recent tsunami destroyed a nuclear power complex.


    HOW JAPAN IS DEALING WITH DECLINING LABOR FORCE


    Japan is admitting foreign workers to increase its labor force. There are now about 3.8 million foreign workers, about 3% of the labor force. Foreign workers, as in Saudi Arabia, the United Arab Emirates and Singapore, are mostly segregated from the locals. Immigrant workers have no citizenship rights and can be deported at any time.


    If Japan makes up the decrease in the size of its labor force with foreign workers, then by 2100 foreigners will make up about half of Japan’s workers.


    Japan is a major producer of robots but the number of robots as a percent of employed workers is below China and South Korea but above other industrialized countries. This percentage (robots per 1,000 workers) is expected to rise. Japan is using some of its robots to provide services and companionship for senior citizens.


    CONSEQUENCES OF JAPAN’S DEMOGRAPHIC DECLINE


    Small number of children


    The projection for Japan is that in 2100 there will be five times as many senior citizens over 65 then children aged 0-14. Children will make up less than 10% of the total population. No one seems to be thinking about the social and psychological consequences of this trend. Importing children for adoption? Surrogate mothers from other countries? Robotic pets and children as substitutes? (No joke – there are already robotic dogs and ponies.)


    Continued cultural isolation?


    Japan has been the most successful country in segregating its culture and moral values from outside influence, first as an island closed to outside influences (1600-1850s) and even now in the global communication world. Despite surface similarities to other modern economies and cultures, Japan remains opaque to outsiders. This might make it difficult to attract permanent immigrants and integrate them into Japanese society. 


    More outmigration of Japanese?


    As the dependency ratio increases, putting a larger tax burden on working Japanese, it is possible that more Japanese will emigrate. One way might be to work for the overseas operations of Japanese corporations. Or join the Japanese communities in other countries such as Brazil or the United States. Or imitate the strategies of wealthy Chinese who are planning to leave their country. This will further decrease the number of births, the size of the labor force and the tax base.


    Family vs. state care of the aged


    With more Japanese not having children, the cultural imperative of children supporting elderly parents will be impossible to fulfill for many families, putting more of the burden on the state.


    Part of the global economy


    It is hard to see what future role Japan will play in the global economy besides as a source of financial capital. Japan might be relatively less important in the future. Already, Japan is not particularly innovative. The country is not a leader in most new tech industries – mostly robotics companies, a few pharmaceutical companies, some legacy technology in consumer electronics and online entertainment. Japan has already outsourced much of its manufacturing to other Asian countries, particularly China.


    ============================================================


    For a other essays on demographic topics, see


    Global Demographics and Population Projections


    Demographics and Economic Growth


    Demographics, Immigration and Future Economic Growth of the United States


  • Global Demographics and Economic Growth

    Global Demographics and Economic Growth

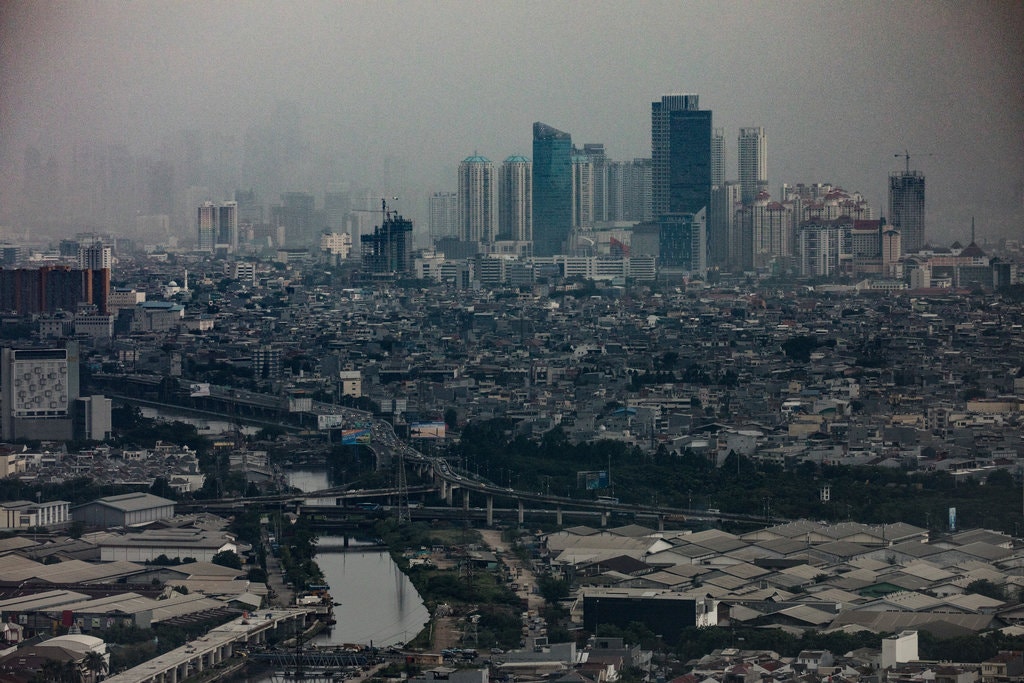
    1. Jakarta – 30 million people and sinking

    GLOBAL DEMOGRAPHICS

    Demographics, the study of the size and composition of population, will shape national and global economic growth and economic policy.  

    The period from 1950 to 2000 was highly unusual. The American “baby boom” started, temporarily reversing the long-term decline in birth rates.  Not just the United States but the global population experienced high birthrates and high population growth rates. In the middle of this period, partly due to more effective and more available birth control, birth rates began a rapid decline. The growth rate in world population began to fall. At the same time, much of the world’s population experienced rising standards of living. One consequence was longer life expectancies and rising average ages in industialized countries.  

    Countries with over a third of the world’s population and most of the world’s output now have birth rates below replacement. They are mostly the wealthy, industrialized countries, including the United States, Canada, Brazil, Western and Eastern Europe, Turkey, parts of Southeast Asia, Japan, Russia and China. Collectively, the size of their labor forces have stopped growing. All countries face the same challenges: Will they be able to invest in economic growth and development (innovation and structural change), deal with environmental costs and climate change effects, and support aging populations?  

    There are falling birthrates for most of the rest of the world’s population, coming down from very high levels. Mexico is at replacement and India is close to the replacement birthrate. But total population continues to grow, partly because of lower infant and child mortality rates, public health programs, better medicine, and subsequently longer lives in most of the world.  

    We are now in a period of a slowdown in total population growth rates. Global population is growing at about one percent per year and the rate continues to fall. But the increase in the number of people is large. In the most recent United Nations projection, the increase in global population from 2020 to 2050 is about 2 billion people, from 7.8 billion to 9.7 billion. The projected population increase over the following 50 years is lower, abour 1.2 billion. 

    Changes in total population may be points on an exponential decay curve. The UN projects that zero population growth will be achieved sometime shortly before 2100. The rate of decline could change with changes in the availability and cost of birth control, education of women, anti-aging medical technologies and more available health care for an aging population. (Estimates of future population are from June 17, 2019 UN projections. UN projections are revised about every two years.)

    The biggest unknown is future medical technology that will prolong life expectancies. Regardless of projection, the fastest growing age cohort is 65 years and over; within that cohort, the fastest growing age group is 80 years and older.

    Countries with birthrates well below replacement and aging populations may experience accelerating decreases in population. Family planning, combined with urbanization and more education of females, could lead to birth rates declining faster than projected in high birth-rate countries. In Africa, Ethiopia, Malawi and Rwanda promoted family planning and have seen large decreases in their birth rates. Kenya, after investing in family planning clinics and information, has seen its fertility rate fall from 6.5 in the late 1980s to 2.4, marginally above replacement and half the rate of most African countries.

    POOR COUNTRIES AND RICH COUNTRIES

    Wealthy countries have below replacement birth rates, no growth or declining populations and labor forces, low real economic growth, and aging populations and labor forces. Population will continue to concentrate in cities; the population of a small number of cities will be responsible for technological innovation and economic development. Rural areas will continue to lose population.

    Poor countries today have high but declining birth rates, young and increasing populations, and populations that want to emigrate (see case study below).

    Most of the largest and fastest growing urban areas in the world are in poor countries, China and India. Over half of the world’s population live in cities and the percent is rising. Almost all of the increased population in poor countries will live in or move to cities, which are already ecological disasters – traffic gridlock, poor air quality, lack of infrasturcture, sinking, raw sewage, and power outages. Many are coastal cities that are already experiencing periodic flooding and storm surges; rising sea levels and the increased number and severity of hurricanes will intensify urban problems. 

    Starting sometime in the 2050s, the world’s population outside of sub-Saharan Africa will stop growing and then slowly decline. All of the world’s net population growth will then be in Africa. How soon the world reaches zero population growth will depend critically on how fast birthrates decline in Africa.

    By 2100, Africa could have about as many people as Asia, about 4-5 billion. Together, Africa and Asia in 2100 could have about 80% of the world’s population.

    Throughout large parts of the Middle East, Africa and Latin America, governments have not been able to provide effective management of economic development for their young, growing population, which have high rates of unemployment and underemployment. Many of the governments are corrupt and/or repressive without free elections or civil liberties. Political activism, partly caused by stagnant or declining standards of living and lack of economic opportunity for young workers, commonly takes the form of mass protests and street demonstrations, aided by Internet social media. Governments typically react with riot police and the military, arrests, torture and prisons, rather than economic and political reform.

    THE DEMOGRAPHICS OF SPECIFIC REGIONS AND COUNTRIES

    A recent survey concludes that 46 countries have declining population or will have declining population in the near future. Declining population is already true in Japan (see below) and Russia and is about to be true in central and eastern Europe. South Korea, also with an extremely low birth rate, is looking at a demographic future similar to Japan’s (see below). South Korea’s current population of 51 million is expected to decline to about 30 million in 2100.

    Russia’s population is declining. Male life expectancies in Russia have been going down for decades but might have recently stabilized. While birthrates are below replacement, the decline of the national population has been offset in recent years by immigration. But lower rates of immigration in 2018 and 2019 have led to large decreases in population. The UN projection is that Russia’s current population of around 146 million will fall to about 85 million by the end of the century. 

    Because of very low birthrates and out-migration, central and eastern Europe is looking at population declines in this generation.  Some UN projections show that most countries in central and eastern Europe might have even larger total percent declines than Japan by the end of the century (over 50%).

    Western Europe is further along the population aging curve but because of immigration of younger people, the decline will not be as precipitous. And western Europe, like Japan, currently starts with more resources to support an aging population.  But high structural unemployment rates, low economic growth, restrictive labor laws and generous early retirement benefits will strain western Europe’s ability to grow and maintain current social welfare levels. A few European countries realize that current levels of social welfare are not sustainable and have begun reviews of retirement and health care programs. This problem is exacerbated by the currently high unemployment and underemployment rates among younger employees.

    China, which has enforced a “one-child” program since the 1970s until 2016, has a very low birthrate of about 1.6. Although this program has been relaxed in recent years, the national birthrate remains far below replacement. China currently has a young average-age population but the average age is rising very rapidly. 

    China’s working-age population began shrinking in 2012.  By around 2050, the decrease will be about the size of the current U.S. total labor force. Next year, the median (half above, half below) age in China will pass that of the United States. By around 2045, the percent of China’s population over the age of 65 will be about equal that of the United States. 

    A mature, experienced workforce should help maintain high but falling economic growth rates for another generation. After about 2050, demographics will begin working against Chinese economic growth. 

    China will grow old before it becomes rich (high per capita income). Even after decades of spectacular growth, per capita income is still about one-third to one-fourth that of South Korea and Japan. Even worse off are the economies of Southeast Asia, with per capita incomes below China, similar birthrates and rapidly aging populations.  

    Given current political strains and a large Chinese population outside of China, it is possible that China will have larger net outmigration in the future.

    DEMOGRAPHICS AND ECONOMIC GROWTH

    The following accounting identity shows the sources of economic growth. An accounting identity says nothing about causality, assumptions or feedbacks. But it introduces some general issues.

    The economic growth rate of a country roughly equals the growth rate of the labor force plus the increase in productivity (output per member of the labor force).

    If the labor force numbers are stable, all of the increase in output depends on the increase in productivity. The pressure on productivity is even greater if the labor force numbers are decreasing. So, for example, if a labor force is increasing at about 1% per year and productivity is increasing at about 1% per year, output will increase about 2% per year. If the workforce stops growing, productivity would have to double to 2% to yield the same economic growth. If the workforce were to decrease at 1% year, as it is in a number of countries already, productivity would have to increase 3% a year to achieve 2% economic growth. This is a high productivity growth rate for a developed economy.

    There is a small amount of research that suggests that an aging labor force is one cause of slowing productivity growth.

    Low rates of productivity growth with accelerating rates of labor force and population decline could lead to less output (negative growth rates) and declining standards of living.

    A member of the industrial/information workforce today is better educated, with new skills, compared to a member of the labor force a generation or two ago. The difference should show up in an increase in labor productivity. Increase in total factor productivity will be due to innovation in capital equipment – including information technology, robotics and artificial intelligence algorithms – and demand for employees with new skills and knowledge. Other factors are public investment and organizational innovation. But these changes have not shown up in productivity measurements. Productivity growth rates are low, although I suspect that the methodology used to compute these figures underestimates the gains.

    Demographics are heavily influencing the areas of investment in wealthy countries; these sectors will drive future economic growth. The three most active areas of research and net investment are robots and AI (reaction to declining workforce), driverless vehicles (same), and biotechnology (health care for an aging population).

    Demographics also influence the demand side of economies. The changing age structure of the economy influences the “market basket” of consumer spending. Certainly the large increase in the number of senior citizens (and their income) is having a major impact on health care spending. To say nothing about the increase in demand for tourism, gambling and south Florida real estate. (I once predicted that marijuana would be legalized when a large number of baby boomers became 65 and older.)

    An aging population is not necessarily bad for economic growth. A healthy population beyond retirement age is leading in the United States to an increasing percent of senior citizens remaining in the work force. With a rising percent of the population over 65 and living longer, health care is a growing percent of output. The health care sector is very innovative, which is a source of economic development and thus economic growth. 

    Companies use demographic information when planning marketing and advertising strategies. Changing demographics are analyzed when developing new products, changing product mix, and segmenting markets. The explosion of detailed demographic information about smaller and smaller segments, including individuals, combined with online marketing technology, is revolutionizing marketing and advertising.

    Areas of the world like Africa face the opposite problem. Working-age population will increase rapidly for a generation or two. But unemployment rates may be high and marginal productivity may be close to zero, or negative in rural areas. With high growth rates of population, economic growth rates will have to be high – over 6% per year – for a sustained period to raise real per capita income (standard of living) and reduce unemployment.  

    IMPLICATIONS FOR ECONOMIC POLICY

    The standard economic models demonstrate that the demographic changes we are seeing are a function of economic growth and development. Industrializing, better educated, urbanizing populations have declining birth rates. But the experience of the poorer regions of the world tends to indicate that these demographic changes are occurring even without economic growth and development.

    Although wealthier countries concentrate on the costs of their rapidly growing retired population, for most of the world the critical question over the next two generations will be how to accelerate economic growth to provide jobs and opportunity for the growing working age population.  The related challenge is how to improve education, training, and economic opportunity to raise standards of living now to provide the resources for the aging population in the future. 

    For the entire world, these objectives are complicated by how to pay for the social costs of past industrialization and environmental degradation, and the future costs of climate change.

    Increasing population and rising real income in emerging economies, especially in Asia, are increasing the demand for energy. China, which had no privately owned cars in 1979, is now the world’s largest automobile market. A dramatic increase in the number of cars is the main reason for the continuing increase in the global demand for oil.  Increased demand for electricity is being met largely with new power plants burning fossil fuels. For at least another generation, these trends will make it difficult to meet global goals to drastically slow down or stop global warming.

    Demographics is interacting with climate change in another important area – food production. Many scientists believe the most serious effect of climate change will be its impact on food production. Global warming and more extreme weather events will make it more difficult to expand food production using current technology. As in other areas, trend projections can be changed by the development of new techology.

    In the long run, the positive side of declining global population will probably be less demand for resources. Combined with substitute technology, global warming might slow down or stop. Climate change might not have quite the devastating effects trend projections indicate.

    The advanced and industrialized countries with stable or declining populations and workforces will have to consider the following:

    Economic growth will have to come from large increases in productivity (output per member of the workforce). To achieve this, and also meet social welfare costs, most countries and regions such as the European Union will have to make radical changes in economic policies. Particularly disruptive and contentious will be the adoption of automated factories and offices. On the positive side they will increase labor and total productivity; on the negative side they will probably eliminate or “deskill” a large number of existing and future jobs.

    Large increases in retirement age populations is leading to serious underfunding of public and private pension funds. Taxes to fund public pension funds are rising rapidly, both in amount and as percent of government budgets. Despite this, unfunded liabilities – promised future benefits not covered by projected future revenue from taxes – are also rising rapidly.

    Multinational corporations will develop and adopt the new technology. Countries that do not have quality education, encourage innovation and change economic incentives will not be able to attract investment and compete in the global economy. And their best educated and most motivated people may go somewhere else, as is happening in eastern Europe and many developing countries.

    On the other hand, poor countries with decent transportation, energy and communication infrastructure will probably attract foreign investment. Real wages of at least part of the labor force will rise.

    Attitudes towards immigration might change from the current restrictive policies of some countries. Attracting “human capital” will be just as important as attracting investment capital. Trans-border movement of people will increase. New national, regional and international agreements will have to be negotiated.  Remittances back to the home country will be a more important part of the economy of many countries and global capital flows. 

    Attitudes about work, labor laws, retirement and retirement ages will change. The benchmark age of 65 was arbitrarily set by Bismarck almost 150 years ago when less than one percent of the German population lived that long. When the United States adopted Social Security, life expectancy was 56 years. The life expectancy of America’s younger workers is already over 80 years.

    DEMOGRAPHICS AND PUBLIC ECONOMIC POLICIES

    If the labor force is not growing or actually shrinking, as it is in most industrialized economies, and the non-working population is growing, one consequence is likely to be growing government budget deficits. Growing government deficits as a percent of GDP may be a function of no economic growth or slow economic growth, not the other way around as suggested by economic research.

    It is how a government spends its income, more than the size of the deficit, that matters. Public investment substitutes for stagnant private consumption spending. Investment, both public and private, substitutes demand for innovation for demand for existing goods. This could increase productivity and result in new products and services. Economic growth then will depend on high levels of new technology and increased productivity (output per employee).

    JAPAN AS A POSSIBLE MODEL (OR WARNING) FOR INDUSTRIAL COUNTRIES

    Figures are from The Economist, “Japan’s economic troubles offer a glimpse of a sobering future,” December 5, 2019.

    Japan is a possible model for the future of other wealthy countries. Japan has a shrinking population and workforce. This will continue. It is not surprising Japan leads the world in developing and installing robots. Robots and AI are also alternatives to immigrants. Japanese companies export capital and technology. Facing falling population, Japan is slowly increasing the number of foreigners allowed into Japan on temporary work permits. But the number remains small, below 1%.

    Japan’s real GDP has been basically stagnant (about one percent per year) over the last 30 years. Without immigration and structural changes to Japan’s political and economic system, Japan’s real GDP in the future will grow slowly at best and eventually decline along with its population. In the long run, Japan will continue on its path to demographic and economic self-destruction.

    CONCLUSIONS

    Demographic trends have important consequences for economic growth and public policies. They cannot be seen in isolation. Neither can any of the other major trends. They are interrelated. 

    ·      Rising global population but at lower rates, mostly in poor countries, for the remainder of the century. After the 2050s, all of the world’s net population increase will occur in Africa. Global population may stop growing by the end of the century. 

    ·      Rising population in poor countries makes high rates of economic growth both pressing and difficult. Emigration pressure from poor regions of the world will probably increase unless there are high rates of economic growth.

    ·      Most of the world’s population increase will take place in cities and surrounding metropolitan areas, creating even larger massive urban areas. Large urban areas are increasing rapidly in poorer countries. 

    ·      Static, falling and aging populations in the wealthier, industrialized countries. Static or declining labor forces mean all economic growth will depend on increases in productivity. To counter demographic trends, technological innovation (robotics and software) leading to high rates of productivity growth will be necessary to increase standards of living (real income per person).

    ·      Problems with unemployment and underemployment, stagnant and declining real incomes and income inequality will probably get worse as artificial intelligence and robotics accelerates the substitution of capital for labor.

    Economic development and growth since the beginning of the Industrial Revolution has been aided by large increases in populations and especially the working age population. But in the future, economic development and growth in most of the world will have to occur with stagnant or declining labor forces and aging populations.

    =====================================================

  • The $100 A Barrel Solution


    The high and sustained price of crude oil is having
    unintended consequences. 


    Global consumption of crude oil rose by 14% between 2000 and
    2010, about equal to the increase in population.  Almost all of the increase was in Asian
    countries, especially China
    and India, and,
    surprisingly, the Middle East and other oil-exporting
    countries.  The Middle East
    as a whole increased oil consumption by 56%, led by Saudi
    Arabia with a 78% increase.  Heavily subsidized and inefficiently used,
    domestic consumption of oil accounts for about one-fourth of Saudi
    Arabia’s huge oil output, about 2.5 million
    barrels a day. 


    In contrast, the U.S.
    and Europe decreased oil consumption by a small amount, less
    than 1% in the U.S, over the same period. 
    Some of this is due to the recession, but there are longer-term trends
    that might lead to continued decreases in total oil consumption.


    It is important to remember that crude oil is an input;
    people and companies like airlines consume refined products.

    Good for U.S. 


    The high and sustained price of crude oil has made it profitable
    to develop huge deposits of shale oil and shale natural gas.  I remember reading a few years ago that
    developing shale oil in the U.S.
    and Canada
    would be profitable if the price of crude oil stayed above $80 a barrel.  Since then, improved extraction technology
    has lowered the breakeven price.


    The U.S.
    also has huge reserves of natural gas in shale. 
    A current estimate is that the U.S.
    has the second largest natural gas reserves in the world.  Some of it is extracted as a by-product of
    shale oil drilling.


    The low price of natural gas will continue the trend of
    substituting it for oil and coal.  One
    advantage is fewer carbon emissions into the atmosphere.  This has already started in the U.S.
    as natural gas accounts for all of the growth in power generation.  Low natural gas prices have led to a large
    substitution of gas for coal in generating electricity so far this year. 


    The Obama administration has just announced strict coal
    emission standards.  About 43% of
    electricity is generated by coal.  The
    percent has been declining but substitution of cleaner natural gas for coal
    will probably accelerate if the standards remain.  They could be weakened or reversed by a
    Republican administration.


    There is no net reduction in carbon emissions if electric
    and hybrid cars are powered by electricity generated from coal. 

    The boom in shale natural gas spurred by the high cost of
    oil has slowed down; prices have fallen and the number of operating wells has
    declined.  But even a moderate increase
    in the price of natural gas still gives it a huge price advantage over $100 a
    barrel oil.


    Gasoline consumption has been going down.  Besides the recession and the higher cost of
    gasoline, other factors are the mandate to use ethanol, and the subsidized
    adoption of electric and hybrid cars.  In
    addition, the Obama administration has announced higher long-run mpg
    requirements for cars.  Higher mpg
    requirements could be reversed by a Republican Congress and president.


    Total fossil fuel energy inputs may go down.  This is almost certain to happen under
    Obama’s comprehensive “cap and trade” plan for all energy.  This will further reduce imports of oil and
    increase demand for domestically-produced natural gas.  Even though originally a Republican idea, it
    is opposed by Republicans and some conservative Democrats, especially from
    coal-mining states.


    A higher percent of U.S.
    oil and gas imports will come from Canada.  This will make us less dependent on hostile
    or unstable suppliers.


    But the big change is that the U.S.
    has become a major exporter of
    refined oil products.  Besides crude, the
    U.S. has been a
    large imported of refined oil products, mostly from Europe.
    U.S. exports
    have risen very rapidly in the last few years to almost $100 billion a year in
    refined oil products.  In 2011, the U.S.
    exported more gasoline, heating oil and diesel oil than it imported for the
    first time since 1949.


    Domestic production reached an eight year high in 2011.  The number of new wells drilled per year
    continues to rise.


    This has dramatically changed America’s
    net imports of oil products.    The
    peak in 2005 was over 12 million barrels a day; last year our net imports were
    8.4 million barrels a day, which was 11% lower than in 2010.  Net imports are expected to fall again in
    2012.


    The underlying trends – increased domestic production of oil
    and natural gas, slowly declining consumption, increased exports – should
    continue the trend of reducing net imports.


    If the U.S.
    expands its oil refining capacity and approves the XL pipeline, there will be long-term
    increase in U.S.
    exports of refined oil products, making the U.S a dominant exporter of refined
    oil products.  Higher crude oil prices
    can be passed on as higher prices of exported refined oil products.  As more imports and domestic production of
    crude are exported, this should also help our balance of payments deficit. 

    Bad for China and Japan (at least in the short run)


    In the short run, high crude oil prices are bad news for China
    and Japan.  Chinese imports of crude and refined oil are
    rising rapidly due to a huge increase in car and truck production.  This year China
    may surpass the U.S.
    as the world’s largest net importer of oil products.  You might also take some comfort that the
    price of gasoline in China
    is $5 a gallon.


    China
    has huge untapped natural gas reserves. 
    As these are developed, they will be used as a substitute for the massive
    amount of coal that is burned to generate electricity.  China
    is the world’s largest producer and consumer of coal; its coal-burning plants
    are inefficient and dirty.


    Japan
    has virtually no domestic oil production, importing all of its crude oil needs.


    Japanese imports of natural gas are also way up as all of
    its nuclear power plants have been shut down. 
    Many, maybe most, will never be restarted.  There is a movement in Japan
    to permanently close all nuclear plants.


    One consequence of all this is that the U.S.
    seems to have a widening cost advantage in energy inputs, especially in
    manufacturing.  Combined with other
    trends, the U.S.
    may become more price competitive in many areas of manufacturing.  A few global companies have already brought some
    manufacturing back to the U.S.
    from China.

    Bad for Iran


    This is counterintuitive. 
    How can high crude oil prices be bad for the world’s third largest crude
    oil exporter?


    Iran
    is also a big importer of refined
    oil products like gasoline.  Domestic
    consumption of refined oil products increased 38% between 2000 and 2010.  The domestic price of gasoline, starting at
    $1.30 a gallon and rising to about $2 a gallon, is heavily subsidized by the
    government,.  Iran
    is selling crude oil at about $2 a gallon and is buying gasoline at about a
    little under $3 a gallon.  The regime is using
    crude oil revenue to heavily subsidize gasoline and other basic consumption
    items, and also giving cash allowances to the poor.  The regime is scared that an increase in
    gasoline prices might spark protests, as it has in other countries, and will increase
    subsidies to the poor to pay for the higher prices.


    These policies buy support for the regime but at a cost of
    using much of their oil export revenue.  The
    result is a corrupt and inefficient economy.


    The longer-term problem for Iran
    is that total crude oil production is going down while domestic consumption and
    imports of refined products is going up. 
    Iran could
    increase domestic production of oil and natural gas but the economic embargo
    and the use of oil revenue for subsidies and nuclear power (and probably nuclear
    weapons development) has meant little increase in domestic refining capacity.  Unless there is a change of policies and use
    of oil revenues, Iran
    may cease to be a net oil exporter.


    The U.S.
    generates more revenue from exporting refined oil products than Iran
    does exporting crude oil.


    Iran
    is the latest example of the oil curse.

    Conclusion


    For the foreseeable future, natural gas will be substituted
    for both oil and coal.  U.S.
    imports of crude oil will continue but probably at the same or lower level than
    now.  More of imported crude will be used
    as the input to produce refined manufactured products that are exported. This is the reason for building the XL pipeline. We will still run a trade deficit in energy
    but it will be a declining percent of GDP.


    It is in the U.S.
    national interest for crude oil prices to remain above $80 a barrel for a
    sustained length of time so that investment in shale oil and shale natural gas
    production and distribution continues.


    Public energy policies, or lack of, will be crucial in
    determining the speed at which these changes occur. 

    ______________________________________________________________________________

    Related Post:  The Oil Curse