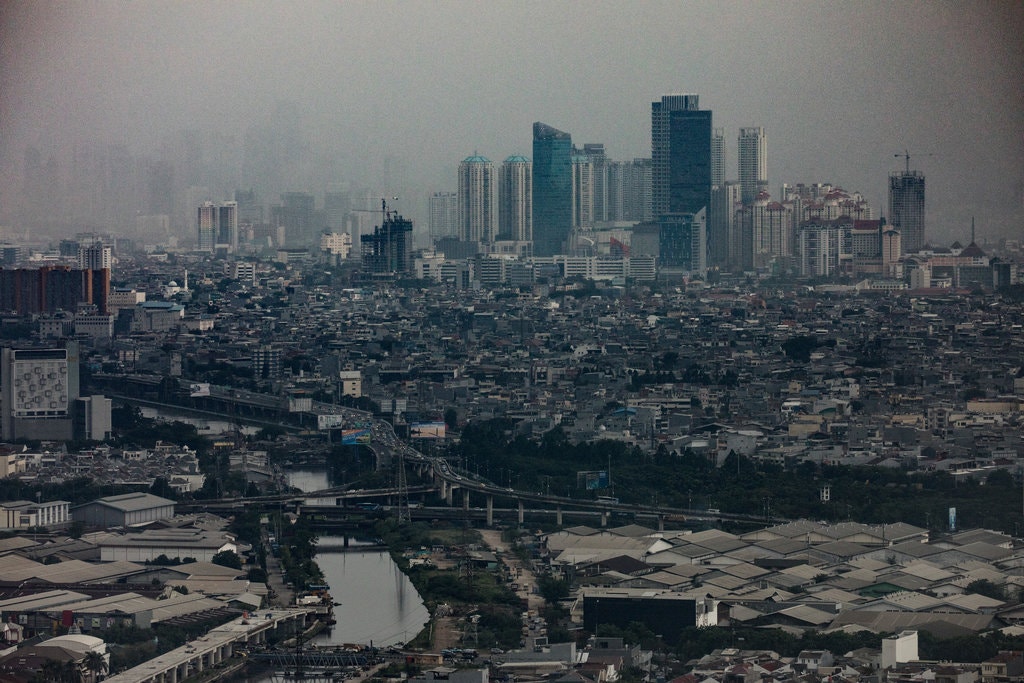
City Life for Most Residents
Before reading this essay and related essays on demographics and population projections, you might want to start with an introduction:
Introduction to Demographics and Global Population Projections
SUMMARY
Global population has more than doubled since 1970, going from 3.7 billion to the current (November, 2023) total of 8.0 billion (UN numbers). The Lancet long-term projection is that world population will peak around 9.7 billion in the 2060s and then begin to decline, reaching around 8.8 billion people in 2100.
In the most recent United Nations projection (2024), global population is expected to peak at about 10.3 billion sometime in the 2080s and then fall to 10.2 billion in 2100.
By 2030, 1.4 billion people will be over the age of 60, with low- and middle-income countries accounting for 80% of older populations. About 25% of the total will be in China. This number is equal to China’s or India’s total population.
Compared to the present, Africa is expected to have about 2.2 billion
more people in 2100. The rest of the world is expected to see a decrease
of about 1.4 billion people. One billion of the decrease will occur in
China and India. The rest of the decrease will occur mostly in Europe,
southeast and southern Asia, and Japan. The United States and Latin
America (because of increasing population in Mexico) will see little
change. But due to recent changes in net immigration, the United States will probably see zero population growth by about 2031 (recent CBO projection) and then slowly decreasing population.
Nigeria’s population growth will be so great that the country will pass China by 2100 as the second most populous country in the world.
China has reached zero population growth. Between now and 2050, 43% of the world’s population increase will be accounted for by only five countries – India, Nigeria, Congo, Ethiopia, and Pakistan. India’s population is expected to peak in the 2060s and then gradually decline.
Europe has the oldest average (median) age. Its population began shrinking in 2020. In 2050, its population will be about 40 million people less.
The following is the summary in the Lancet study.
The global population is projected to peak in 2064 at 9·7 billion people and decline to 8·8 billion in 2100. Findings also suggest a shifting age structure in many parts of the world, with 2·4 billion individuals older than 65 years and 1·7 billion individuals younger than 20 years globally in 2100. By 2050, 151 countries (out of 200) were forecasted to have a TFR lower than the replacement level (TFR <2·1), and 183 were forecasted to have a TFR lower than replacement by 2100. 23 countries, including Japan, Thailand, and Spain, were forecasted to have population declines greater than 50% from 2017 to 2100; China’s population was forecasted to decline by 48·0% to around 750 million.
DEFINITIONS AND BIRTH RATE PROJECTIONS
Demographics is the study of populations and how a population breaks down by age, gender, race and other variables. In this post, I will concentrate on trends and forecasts of the future population of the entire world and by regions and countries. Other posts concentrate on Japan and the United States in greater depth.
There are two concepts that are crucial to population projections:
Total Fertility Ratio (TFR). This is the ratio of the average number of children of women in child-bearing ages. For a population to be stable, women must have an average of 2.1 children each. Any smaller number means the population is “below replacement” and may decrease in the future.
The global birth rate (total fertility rate) is now about 2.3, slightly above the replacement rate of 2.1, and falling.
The global Total Fertility Ratio (TFR) in the Lancet study is forecasted to be 1.7 in 2100. By 2050, 151 countries were forecasted to have a TFR lower than the replacement level and 183 countries (out of approximately 193 countries) were forecasted to have a TFR lower than replacement by 2100.
A country may have below replacement birth rates and for some time also have expanding population if in the past it had above replacement birth rates, a large percent of its population were children and young adults, and the adult population is experiencing rising life expectancies. Or, the decrease in population is offset by immigration.
For Europe, the birth rate went below replacement in the 1970s and population stopped growing in 2020. For China, an extremely low birth rate started in the 1990s (one child policy), never recovered even when the policy was abandoned. China’s population probably peaked in 2023.
Dependency Ratio. This is the ratio of the age categories (usually children plus over 65) to the working-age population. In aging societies, it is often the ratio of 65 and older to the working-age population.
MAIN SOURCES OF POPULATION PROJECTIONS
Until 2020, the standard source of long-run population projections was United Nations Population Division of the Department of Economic and Social Affairs, “World Population Prospects 2024.”
A new set of projections was published in Lancet in 2020:
Stein Emil Vollset, et al, “ Fertility, mortality, migration, and population scenarios for 195 countries and territories from 2017 to 2100: a forecasting analysis for the Global Burden of Disease Study,” Lancet, 2020,
Published Online July 14, 2020 https://doi.org/10.1016/ S0140-6736(20)30677-2
It seems to me that the methodology use by the Lancet study is preferable to the United Nations study. Lancet authors’ explanation of their methodology is quoted in the appendix.
The Lancet projections, based on trends into the 2010s, may be too high.
INTRODUCTION
The posts on demographics contain long-term forecasts. They give the best estimates, given the assumptions. All contain large ranges of uncertainty (standard deviations or uncertainty interval). Generally, the further out the forecast, the larger the uncertainty interval. It is impossible to forecast major changes in health care technology, immigration laws and other variables that could change the exponential trends.
With low birth rates in many parts of the world, an “exogenous” (outside) event like Covid or the war in Ukraine can affect intermediate (2050) or long term (2100) projections for an individual country, region, or the entire world.
Over the last few years, there has been major changes in global demographic forecasts. Generally, they have forecasted slower rates of growth, earlier dates for maximum population (2060s), and shrinking population from maximum population to the year 2100.
GLOBAL POPULATION
Since the beginning of the Agricultural Revolution about 10,000 years ago, demographics meant high birth rates, high infant mortality rates, low life expectancies, and high death rates. Until the Industrial Revolution, starting in the late 1700s. Death rates fell faster than birth rates; better health and health care reduced infant mortality rates.
At the same time, much of the world’s population experienced rising standards of living. Better public health reached poorer parts of the world. Urbanization, which lowers birth rate, greatly expanded. Better education, especially for females, is correlated with falling birth rates. One consequence was longer life expectancies and rising average ages in industrialized countries and then in poorer countries. The age composition of the global population changed, as the average age of the populations in most countries started rising.
During this transition period, from the late 1800s to the present, average life expectancies increased from roughly 30 years to 75-80 years in industrializing countries.
After World War II, the global population exploded:
1900 – Approximately 1.6 billion people
1950 – 2.6 billion
2000 – 6.1 billion
2020 – 7.7 billion
2024 – 8.0 billion (November, 2023)
This spectacular increase in population, combined with equally spectacular increases in energy-intensive production and consumption, has contributed to the current global warming crisis. This is more amazing because the earth was in a long-term, gradual cooling cycle. For an excellent book that explains the science and history behind long-term climate cycles, see Peter Brannen, The Story of CO2 is the Story of Everything: How Carbon Dioxide Made Our World, 2025,
Again, the Lancet global population projections are:
2064 – 9.7 billion (the peak global population)
2100 – 8.8 billion
The period from 1950 to 2000 was unusual. Not just in the United States, the global population experienced high birthrates and high population growth rates. In the middle of this period, partly due to more effective and more available birth control, birth rates began a rapid decline in the industrialized countries. The growth rate of the world population began to slow.
The industrialized and modernizing parts of the world now have low birth rates – mostly below replacement – and low death rates. Birth rates are also falling in much of the rest of the world. One factor that is seldom discussed is that birth rates continue to fall in countries that are already at below replacement. One example is the United States.
Declining population is already true in Japan, China and Russia, and parts of central and eastern Europe and much of East Asia (including Japan, Taiwan, and South Korea). European countries will see 30-50% decreases in the long run.
It is important to remember, but seldom discussed, that a projection of declining population or shrinking labor force to 2050 or 2100 does not mean that the decreases stop in those years. These are points on an exponentially declining curve. Decreases in total population eventually fall, as the number of children declines, the number of adults below 65 years of age fall, and then the number of senior citizens fall.
This assumes no technological or attitudinal changes leading to higher number of births, that a higher percent of heathier seniors will not work longer or retire later, that projections of longer life expectancies are not dramatically higher. Also, no speculation about the future possibility of massive migration, the long-term effects of global warming and climate change, or changes in retirement ages, laws, and programs. No speculation on when the research and innovation in health care technology will become widespread.
As populations and the labor forces of a country decrease, it is possible that income per capita will continue to rise for a generation or two. But in the long run, income per capita will probably fall.
Some of the more speculative projections are that a world of robots and AI may replace some or much of the future declining labor force and increase productivity. If so, it may be that a shrinking, aging population may also have a rising standard of living. But it is nearly impossible to predict technological and organizational change over the next 25 or 50 years.
GLOBAL DEMOGRAPHICS
Outside of Africa, the global birth rate is already below replacement but longer life expectancies will lead to continued population growth for one or two generations. About 43 countries already have declining populations.
Countries with over a third of the world’s population and most of the world’s output now have birth rates below or at replacement. They are mostly the wealthy, industrialized countries, including the United States, Canada, Brazil, Western and Central Europe, Turkey, parts of Southeast Asia, Japan, Russia and China. Collectively, the size of their labor forces has stopped growing. India has a falling birth rate that just fell below replacement. This will add another 17% of the world’s population that has a below replacement birth rate.
There are falling birth rates for most of the rest of the world’s population, coming down from very high levels. But total population continues to grow, partly because of lower infant and child mortality rates, public health programs, better medicine, and longer lives in most of the world.
Barring catastrophe or economic collapse from increasing population, Africa will probably not reach zero population growth until some time around 2100. Possibly sooner if birth rates fall faster than currently forecasted.
Regardless of what happens to the size of the labor forces in individual countries, the size of the global labor force after around 2100 will start to fall. A global question may be how it is allocated.
All countries will face the same challenges: With declining populations and smaller labor forces, will they be able to invest in economic growth and development (innovation and structural change), deal with environmental costs and climate change, and support aging populations?
GLOBAL FORECASTS
The following are forecasts in the Lancet long-run projection. First, a summary of the global forecast.
|
Region |
2017 Population in billions |
Projected 2100 Population in billions |
2017 Birth Rate |
Projected 2100 Birth Rate |
|
Global |
7.64 |
8.79 |
2.37 |
1.66 |
The total global population in 2024 is around 8 billion. A maximum global population of around 9.7 billion is expected to occur around 2064. The global birth rate will be below replacement. So over the next 40 years (2025-2065), the world’s population will rise by about 1.7 billion and then over the 35 years after that, decline by approximately 0.9 billion (900 million). By 2100, the global population will have fallen to 8.8 billion.
We are now in a period of a slowdown in total population growth rates. Global population is growing at about one percent per year and the rate continues to fall. But the increase in the number of people is large, about 80 million people a year.
Changes in total population may be points on an exponential decay curve. The decline in numbers after achieving the maximum in the 2060s may be slow for a few years and then accelerate. The timing will depend on how fast the African birth rate falls.
The rate of decline could change with changes in the availability and cost of birth control, anti-aging medical technologies, and more available health care for an aging population.
The biggest unknown is future medical technology that will prolong life expectancies. Technological advances might also decrease medical costs per capita. Regardless of the projection, the fastest growing age cohort in the foreseeable future is 80 years and older.
Countries with birthrates well below replacement and aging populations will experience accelerating decreases in population.
POOR COUNTRIES AND RICH COUNTRIES
Wealthy countries have below replacement birth rates, no growth or declining populations and labor forces, low real economic growth and aging populations and labor forces. Population will continue to concentrate in cities; the population of a small number of cities will be responsible for technological innovation and economic development. Rural areas will continue to lose population.
Africa and a few poor countries outside of Africa will have the opposite problem. They will have above replacement birth rates for a generation or two. This will lead to high growth rates in labor force age groups and total population. Whether or not this will translate into high economic growth rates is problematic, depending on many other factors. These countries could be a source of large immigration to richer countries.
Poor countries typically have poor infrastructure, poor education and health facilities, diseases and epidemics, parasitic and corrupt political elites and bureaucracies, military coups, and internal violence including civil wars for political control.
INTERREGIONAL CHANGE
The global figures hide big regional differences. About half of the world’s projected population growth between 2022 and 2050 is expected to occur in eight countries, five in Africa (Congo, Egypt, Ethiopia, Nigeria and Tanzania) and three in Asia (India, Pakistan and the Philippines). Africa recently passed the combined populations of the United States and Europe. In 1980, Africa’s population was one-third that of the U.S. and Europe.
Most of the largest and fastest growing urban areas in the world are in populous poor countries, including Indonesia, Pakistan, Nigeria and India. Over half of the world’s population live in cities and the percent is rising. Almost all of the increased population in poor countries will live in or move to cities, which are already ecological disasters – traffic gridlock, poor air quality, lack of adequate infrastructure, sinking, raw sewage, and power outages. Many are coastal cities that are already experiencing periodic flooding and storm surges; rising sea levels and the increased number and severity of hurricanes will intensify urban problems. (See the example of Niger in The Economist (July 1, 2023, 15) for the human side behind the statistics. Niger has one of the highest birth rates in the world.)
Starting sometime in the 2060s, the world’s declining population outside of Africa will equal Africa’s population growth. Africa’s population is expected to grow from about 2.7 billion in the 2060s to about 3.5 billion in 2100. The rest of the world will see population fall from about 7.0 billion in the 2060s to 5.3 billion in 2100, or 1.7 billion. Of this total, about one billion of the decrease will occur in China and India.
The forecast is that the world’s birth rate in 2100 will be below replacement, at 1.66. How soon the world reaches zero population growth will depend critically on when the world’s birth rate falls below replacement, which in turn depends on how fast birth rates decline in Africa.
By 2100, Africa could have about as many people as Asia, about 3.5 billion. Together, Africa and Asia in 2100 could have about 80% of the world’s population. Europe and the United States together will have about 10% of the world’s population. Globally, this will be a world with substantially more people over the age of 65 than under 20 – 2.4 billion vs. 1.7 billion.
There will be significantly different population patterns by region and by country. Many countries in Africa will double or triple in population. Many countries outside of Africa will have a lower population. Some countries, 23 in all, including China, Japan, South Korea, Thailand, Spain and Bulgaria will see their populations cut in half by 2100.
The remaining populations outside of Africa will also be older. Countries with large population decreases mean old populations, with a high percent of over-65 and a low percent of children. Africa will have the “youngest” regional population, which is one reason that the region’s population can continue to grow even as birth rates fall below replacement.
THE DEMOGRAPHICS OF SPECIFIC REGIONS AND COUNTRIES
The Lancet projections for the six most populous countries in 2100 are India (1·09 billion), Nigeria (791 million), China (750 million), the United States (336 million), and Pakistan (248 million). The projections are probably too high for India and the United States if the birth rate in India continues to fall and the current (2025) immigration and deportation policies of the United States continue.
SUMMARY OF REGIONAL PROJECTIONS
|
Region |
2017 Population |
Projected 2100 Population |
2017 Birth Rate |
Projected 2100 Birth Rate |
|
Africa |
1,227 |
3,504 |
4.62 |
1.73 |
|
Central Europe |
115 |
52 |
1.43 |
1.35 |
|
Eastern Europe (Includes Russia) |
210 |
135 |
1.55 |
1.45 |
|
High Income East Asia |
187 |
94 |
1.30 |
1.33 |
|
North America |
361 |
380 |
1.79 |
1.54 |
|
Western Europe |
433 |
375 |
1.59 |
1.64 |
|
Latin America |
582 |
575 |
2.18 |
1.58 |
|
South Asia |
1,783 |
1,440 |
2.27 |
1.33 |
|
Southeast & East Asia |
2,159 |
1,435 |
1.72 |
1.61 |
Lancet
By the end of the century, every region and almost every country will have a birth rate below replacement.
By 2100, Africa could have about as many people as in Asia, about 3.5 billion. Together, Africa and Asia in 2100 could have about 80% of the world’s population. The United States plus all of Europe (including Russia) might have about 10% of the world’s population.
AFRICA
|
Year |
Millions |
% Increase |
Millions Increase |
|
|
1960 |
284 |
29% |
|
|
|
1970 |
366 |
29% |
82 |
|
|
1980 |
483 |
32% |
117 |
|
|
1990 |
644 |
33% |
161 |
|
|
2000 |
831 |
29% |
187 |
|
|
2010 |
1,072 |
29% |
241 |
|
|
2020 |
1,381 |
29% |
309 |
|
In 2024, Africa’s population was estimated to be 1,515 million (1½ billion). (UN numbers) Current UN projection is that Africa’s population will increase to about 2.5 billion by 2050 and 3.5 billion in 2100.
|
Region |
2017 Population |
Projected 2100 Population |
2017 Birth Rate |
Projected 2100 Birth Rate |
|
|
Sub-Sahara |
1,026 |
3,071 |
4.62 |
1.73 |
|
|
North Africa |
201 |
433 |
|
|
|
|
Africa Total |
1,227 |
3,504 |
|
|
|
Lancet projections
Between 2010 and 2020, in just 10 years, the African population increased about the same amount as the total population of the United States. The increase in African population in this decade (2020-2030) will probably be greater, despite the impact of Covid. Better vaccines and control methods of malaria, Africa’s health scourge, are being perfected and produced.
Africa is the poorest region in the world. Africa’s population is expected to triple between 2017 and 2100. By the end of the century, Africa will have 40-45% of the world’s population.
Sub-Saharan Africa’s 2024 birth rate is about 4.3 – 4.4 children per woman past child-bearing ages, by far the highest regional birth rate in the world. This number is expected to fall to about 1.7 in 2100. North Africa’s collective birth rate, dominated by Egypt, might be near replacement.
It will still be the highest regional birth rate in the world. Although below replacement, Africa’s population will still be increasing at the end of the century but may be close to its maximum.
Family planning, combined with urbanization and more education of females, could lead to birth rates declining faster than projected in high birth-rate countries. In Africa, Ethiopia, Malawi and Rwanda promoted family planning and have seen large decreases in their birth rates. Kenya, after investing in family planning clinics and information, has seen its fertility rate fall from 6.5 in the late 1980s to 2.4, marginally above replacement and half the rate of most African countries.
This is a good example of exponential growth. Although the growth rate remains about constant, around 30% per decade (2.4% per year), the 10-year increase in population gets larger as the base increases over time.
The working age population in sub-Saharan Africa will increase by about 700 million (!) by 2050. This will be roughly equal to the current working-age population of China or India. Although Africa will have a large increase in population, its young population will lead to a small percent increase in senior citizens.
Projected populations for the most populous countries are:
|
Most Populous Countries |
2017 Population |
Projected 2100 Population |
2017 Birth Rate |
Projected 2100 Birth Rate |
|
|
Nigeria |
206 |
790 |
5.11 |
1.69 |
|
|
Ethiopia |
103 |
225 |
4.79 |
1.33 |
|
|
Egypt |
96 |
200 |
2.66 |
2.08 |
|
|
Congo (DRC) |
81 |
245 |
5.05 |
1.75 |
|
|
Tanzania |
54 |
185 |
4.79 |
1.60 |
|
Lancet projections
I find the population number for Nigeria in 2100 astonishing. Nigeria’s population is currently around 230 million and is expected to be about 750-800 million by 2100. In that year, Nigeria’s population is expected to be about equal to China’s population and second only to India’s. The populations of the Congo and
Africa and some poor countries outside of Africa will have the opposite problem of richer countries and regions. They will have above replacement birth rates for a generation or two. This will lead to high growth rates in labor force age groups and total population. Whether or not this will translate into high economic growth rates is problematic, depending on many other factors. These countries could be a source of large numbers of immigrants to richer countries.
The long-term high birth rates and population growth rates partly explain why from 1970 to 2024 sub-Saharan Africa’s inflation-adjusted (real) GDP per person has not increased. Sub-Saharan population went from 290 million in 1970 to 1.3 billion in 2024, over 2% compounded yearly growth. Real income per person has remained around $1,500. Sub-Saharan’s economic future will partly depend on how fast the current birth rate declines.
RUSSIA
Russia’s population is declining. The UN projection is that Russia’s current population of around 145 million will fall to about 85 million by the end of the century, about a 40% decrease. The Lancet projection is around 105 million, about a 30% decline. Projected future birth rate of 1.43 is about the same as the current birth rate of 1.42.
Russia has avoided a large decrease in its population by encouraging immigration, mostly from former republics of the Soviet Union. While birthrates are below replacement, the decline of the national population has been offset in recent years by immigration. The Lancet projection was made right after a period of large immigration, which has since slowed down. Lower rates of immigration since 2018 have contributed to decreases in population.
Male life expectancies in Russia have been going down for decades but might have recently stabilized (Russian statistics are suspect). Russia was particularly hard hit by Covid because of low levels of vaccination from an ineffective domestically produced vaccine. Russia has the world’s highest per capita consumption of alcohol and poor health care facilities outside of the major cities. The war in Ukraine has resulted in a large number of deaths and serious injuries. Also a large recent migration among educated young male adults, which might affect future population and economic growth projections.
CENTRAL AND EASTERN EUROPE
Because of past very low birth rates and high levels of out-migration, central and eastern Europe is looking at population declines in this generation. It is already happening in the Balkan countries. The war in Ukraine has led to millions of emigrants; how many will return is unknown.
Some UN projections show that many countries in central and eastern Europe might have even larger total percent declines than Japan by the end of the century (over 50%). The region as a whole will probably see a population decline of about 50% by 2100 to less than 100 million people (without Russia). This means that the “borderlands” of Europe, a traditional source of violence and target for conquest, will be depopulated. Total population of all of central and eastern Europe might be less than the population of Russia.
WESTERN EUROPE
Western Europe is further along the population aging curve but because of immigration of younger people, the decline will not be as precipitous. Countries in western Europe draw in immigrants from central and eastern European countries in the European Union and from former colonies. And western Europe, like Japan, currently starts with more resources to support an aging population. But high structural unemployment rates, low economic growth, restrictive labor laws and generous early retirement benefits will strain western Europe’s ability to grow and maintain current social welfare levels. A few European countries realize that current levels of social welfare are not sustainable and have begun reviews of government retirement and health care programs. This problem is exacerbated by the currently very high unemployment and underemployment rates among younger employees.
Facing the future, a number of Western European countries have set up programs to encourage legal migration from outside the European Union, in addition to migration from central European countries within the EU. But increase in immigrants is currently being met with increasing domestic opposition and the rise of anti-immigration political parties.
CHINA
Demographics Update (August 8, 2025)
China’s slowly decreasing total population masks rapid and large changes in its age distribution. Between 2021 and 2024, the number of pre-school children (3 to 6 year olds) fell from 48 million to 36 million. The number is expected to fall another 14 million in the next five years as the birth rate of 1.0 is one of the lowest in the world. In contrast, over the same period, the number of people aged 65 and over is projected to rise from 211 million to 256 million, according to UN projections.
China, which enforced a “one-child” program from the 1970s to 2015, has one of the lowest birthrates in the world, around 1.1 (2023) and probably falling. Although the “one-child” program has been relaxed and then abandoned in recent years, the national birthrate is below that of the “one-child” period around 1.5 in the 1990s. The number of children is expected to fall about 50 million from around 2020 to 2035.
China currently has a relatively young average-age population but the average age is rising very rapidly because of the very low long-term birth rates.
China’s total population probably has already reached its peak of 1.4 billion people. The Lancet projection is a decline to about 750 million people in 2100. Thus China will account for most of the global decline of population.
China’s working-age population began shrinking in 2012. By around 2050, the decrease will be about the size of the current U.S. total labor force (170 million).
China has a special problem that could affect future demographics. Chinese youth, ages 19-24, have a very high unemployment rate, probably over 20% and possibly much higher. The government stopped publishing statistics and then came out with a new series with a lower unemployment rate. Colleges graduates in particular are finding it hard to get a decent position; many are unemployed, accepting menial jobs just to earn small amounts of income, or are moving in with relatives. The government’s policy is to tell the unemployed youth to “eat bitterness.”
At a minimum, this will probably affect future demographics and economic growth – lower income, later marriages. This is in addition of a dearth of females because of the past “one child” policy that led to tens of millions of abortions of female embryos and female infanticide.
As in the United States, a stagnant or declining population is not spread evenly across the country. Government policies to help rural and inland areas do not seem to be working. Between 2010 and 2020, 1,240 counties and county-cities out of 1,866 saw their populations shrink, many by up to 35%, as birth rates fell to record lows and people continued to go to cities in search of work.
The Economist, “China’s last boomtowns show rapid growth is still possible,” July 30, 2024.
Next year (2025) the median (half above, half below) age in China will pass that of the United States. China’s over-60 population of over 300 million is already close to the total population of the United States. By around 2050, the over-60 population is projected to be over 500 million, over 35% of China’s total population.
China’s first reaction to this trend has been to slowly raise their low retirement ages over 15 years. For men, the retirement age is being raised from 60 to 63. For women, from 55 to 58 for white-collar workers and from 50 to 55 for blue-collar workers. A related reason is that the public pension costs are “squeezing” government budgets. (The Economist, “The World in Brief,” September 13, 2024).
A mature, experienced workforce should help maintain high but falling economic growth rates for another generation. After about 2050, demographics will begin working against Chinese economic growth.
This policy will be very unpopular. Traditionally, families were multi-generational and children (daughters and daughters-in-law) were expected to care for aging parents. But hundreds of millions of the working-age population have migrated from rural areas to cities, leaving their children in the care of grandparents. A rising percent of women in the cities are working. If retirement ages are raised and grandparents in both the cities and countryside have to work longer, there may be less baby-sitting. This might lower the birth rate even more. In addition, China has strong age discrimination, so that the older population might have to wait longer between being employed and receiving a retirement pension.
China has massive internal migration. It is governed by hukou system, which has roots in Chinese history.
In the hukou system, everyone carries a household registration card with the individual’s place of birth. More than half of China’s population have a rural hukou. Individuals cannot legally change their hukou without official approval. But China’s need for large amounts of labor in cities and industrial areas has created a demand for “illegal” migrants.
The migrants have virtually no rights or legal protection. They have no access to social services, health care or education. Wages are often below the official minimum and they can be “deported” back to their home location at any time.
This creates an exploited underclass similar to illegal immigrants in other countries. The number of rural migrant workers in China is maybe around 300 million, comprising more than one third of the Chinese labor force. Official Chinese 2020 census figures put the rural hukou population at 376 million people.
Rural migrant laborers propelled the extraordinary boom of China’s economy over the last decades but are still subject to discrimination and unfair treatment. Their children are often separated from their parents for years and raised by grandparents. The government is slowly improving the legal status of some rural migrant workers but fears that former rural migrants might lead to higher unemployment in the major cities.
The minimum government-funded pension has been raised to about $22 a month. Migrant workers receive lower pension than those registered as city residences. They average about $28 a month. The government is slowly allowing some long-term hukou workers in cities to qualify for the higher pensions of city residents.
Statista, “Migrant workers in China – statistics and facts,” June 3, 2024.
The Economist, “Sunset Delayed,” September 21, 2024, 38-40.
EAST AND SOUTHEAST ASIA – GROWING OLD BEFORE GETTING RICH
Most countries in East Asia are “middle-income” countries, with per capita income of $7,000 or less. They are becoming “aged” societies (14% of population over 65) with 1/5 to 1/10 the per capita income that Japan had when it reached this level.
South Korea has the lowest birth rate in the world of 0.7, followed by Taiwan with a birth rate of 0.87. Taiwan’s total population has already stopped growing.
Because of low birth rates in the past, these countries are aging rapidly, more rapidly than rich countries like Japan, western Europe and the United States did in the past.
South Korea and Taiwan are looking at demographic futures similar to Japan’s. South Korea’s current population of 51 million is expected to decline to 30 million or less by 2100. Taiwan’s population is expected to fall from 24 million currently to 11 million in 2100 despite a slight increase in the birth rate.
Indonesia, the Philippines and Vietnam are expected to have different trajectories. Indonesia, with a current population of 260 million and a birth rate close to replacement, might have about the same or slightly lower population in 2100. The Philippines has a high birth rate (3.2) and might see its population go from 105 million now to 170 million in 2100. Against this increase is the probability that the Philippines will continue to have high rates of emigration. Vietnam, with a current population of around 100 million, is expected to experience a decline to about 75 million in 2100.
Looking at Asia as a whole, “Asia will account for 70% of the expected increase in senior citizens in poor countries by 2050.” (The Economist, “Old before their time,” October 14, 2023, 31)
These countries, like China, are transitioning from having mature, experienced labor forces to retirement. A large mature labor force is good for economic growth. It is problematic how a country with a rapidly increasing percent of its population in the retirement ages will continue to experience economic growth.
As in China, families have been a traditional source of care for the elderly. This is starting to break down as children migrate to the cities and more women have entered the labor force. Governments have been slow to provide support for their aging populations, although this is starting to change.
SOUTH ASIA: INDIA, BANGLADESH AND PAKISTAN
India has a population of 1.4 billion people, about the same as China. The two countries together contain 35% of the world’s total population.
Unlike China, India’s population is expanding. The Lancet projection is that India will reach a maximum population of around 1.6 billion in 2048 and then begin falling to 1.1 billion in 2100. Thus, by 2100, India and China will account for a decrease of about one billion people from today’s total.
India’s birth rate is around 2.1, just at or above the replacement rate. Lancet’s projection is a continuous fall in India’s birth rate, reaching 1.3 in 2100.
India, like China, experiences massive internal migration. Based on a recent census, India has approximately 450 million internal migrants. They are mostly from the poorer north going to the richer south, replacing the south’s aging labor force.
Bangladesh’s population is around 160 million people. Lancet expects its population to decrease to about 80 million by 2100, a 50% decline. Bangladesh’s current birth rate is just below replacement but is expected to fall to 1.2 in 2100.
Pakistan is another populous country, with 215 million people. It also has a high birth rate, at 3.4. After reaching a peak population of about 315 million in 2062, Pakistan’s population is expected to fall to about 250 million in 2100, with a low birth rate of 1.3.
LATIN AMERICA
Latin America’s population of 582 million in 2100 is about the same as today. But without Mexico, Latin America’s population would decrease by 50 million.
Lancet projections for the largest countries in Latin America:
|
Latin America |
582 |
575 |
2.18 |
1.58 |
|
|
Most Populous Countries |
2017 Population |
Projected 2100 Population |
2017 Birth Rate |
Projected 2100 Birth Rate |
|
|
Brazil |
212 |
165 |
1.76 |
1.44 |
|
|
Mexico |
127 |
145 |
2.42 |
1.44 |
|
|
Columbia |
51 |
47 |
2.12 |
1.45 |
|
|
Argentina |
44 |
48 |
2.17 |
1.62 |
|
|
Total |
434 |
405 |
|
|
|
The following is mostly a summary of The Economist, “Continent of discontent,” September 7, 2019, 81.
Gallup polls reveal that 31% of the population in Latin America want to leave their countries, about the same percent of the people polled in Africa and the Middle East. Latin Americans are fed up with violence and poverty, especially in southern Mexico, El Salvador, Honduras and Guatemala. Over 4 million people – about 13% of the population – have already left Venezuela. There have been recessions in Brazil and Argentina, in addition to 64,000 murders in Brazil in 2017. Drug gangs are a threat in many Latin American cities and countries. Much of the post-war increase in income and wealth has gone to a small percent of the population, a reason for the recent demonstrations in Chile. Overall, Latin America has had little economic growth since 2015.
Corruption is everywhere. 80% of those polled in Latin America think their government is corrupt. According to another poll, “the share of Latin Americans dissatisfied with how democracy works in their country has risen from 52% in 2010 to 71% in 2018.”
Since 2018, autocratic populists who campaigned against corruption and crime won presidential elections in Brazil (a conservative), Mexico (a leftist) and other countries. Argentina has elected an outsider who promises major changes in a society racked by high rates of inflation.
If voters remain disenchanted and disgusted, more autocratic leaders are likely to be elected. And emigration pressure on U.S. southern borders will increase.
——————————————————————————————–
APPENDIX
Lancet Methodology (Quoted from the authors of the Lancet study)
We modelled future population in reference and alternative scenarios as a function of fertility, migration, and mortality rates. We developed statistical models for completed cohort fertility at age 50 years (CCF50). Completed cohort fertility is much more stable over time than the period measure of the total fertility rate (TFR). We modelled CCF50 as a time-series random walk function of educational attainment and contraceptive met need. Age-specific fertility rates were modelled as a function of CCF50 and covariates. We modelled age-specific mortality to 2100 using underlying mortality, a risk factor scalar, and an autoregressive integrated moving average (ARIMA) model. Net migration was modelled as a function of the Socio-demographic Index, crude population growth rate, and deaths from war and natural disasters; and use of an ARIMA model. The model framework was used to develop a reference scenario and alternative scenarios based on the pace of change in educational attainment and contraceptive met need. We estimated the size of gross domestic product for each country and territory in the reference scenario. Forecast uncertainty intervals (UIs) incorporated uncertainty propagated from past data inputs, model estimation, and forecast data distributions.
======================================
For two detailed studies, see
Demographics, Immigration and Future Economic Growth of the United States
Demographics and Population Projections of Japan
Also see