
Tag: monetary policy

  • Government Finance 101. Fiscal Policy:  Welcome to Alice in Wonderland

    Government Finance 101. Fiscal Policy: Welcome to Alice in Wonderland

    Secretary of the Treasury

    PRELIMINARY SUMMARY OF FISCAL YEAR 2025 BUDGET


    The Congressional Budget Office (CBO) made their latest projection in January, 2025. The projected deficit in fiscal year 2025 will be around $1.8 trillion, the difference between about $5.2 trillion in revenue and $7.0 trillion in expenses. Interest on the national debt this year will be around $950 billion, over twice the interest expense in the fiscal year 2021 budget and equal to the defense budget. By 2035, the CBO expects the yearly budget deficit to increase to $2.7 trillion.


    Interest expense this year passed budgeted outlays for the military. It is about equal to Medicare, and also to total non-defense discretionary spending.


    Leaving aside Social Security and Medicare, interest expense is about 20% of total budget outlays. Interest expense is about half the budget deficit.


    The $1.8 trillion budget deficit is 6-7% of total GDP, or approximately 10% of consumer spending. Adding the $1 trillion trade deficit, which is 3-4% of GDP, then a total of $3 trillion, or 10% of GDP, is being financed by these two deficits.


    SOME BASIC DEFINITIONS AND A LITTLE DETAIL


    Some basic definitions for people in government suffering from political amnesia:


    Deficit.  The difference between the federal government’s spending and its revenue in one fiscal year.  The fiscal year starts on October 1. So fiscal year (FY) 2025 started on October 1, 2024. All years in this post are fiscal years. You know right away this is going to be confusing.

    Debt.  Short for national debt or federal debt.  The sum total of all past government yearly deficits minus yearly surpluses.


    PROJECTED NATIONAL DEBT


    As of June 9, 2025, the national debt was $36.2 trillion. The debt/GDP ratio was 124%. The CBO expects it to increase to $59 trillion by the end of fiscal year 2035. So between now and 2035,

    the national debt will increase by about $23 trillion!


    On August 4, the CBO estimated that the recently passed budget bill will add at least $4 trillion more to the national debt over the next 10 years, more likely $5 trillion.  Beside making the “temporary” 2017 tax cut permanent, the budget bill included large increases in defense spending and spending to deport residents. Next month, however, the CBO will attempt to estimate how much tax revenue the government will earn from increased tariffs. The possible range is about $2-$3 trillion over 10 years. So the net effect is a rather small increase compared to the projected $59 trillion national debt in fiscal year 2035. The big question, however, is whether the tariffs will lead to higher rates of inflation in the short run and a recession in the longer run.


    At some point, buyers of government debt will demand higher interest rates because of higher risk or higher rates of inflation. Higher rates are not factored into CBO debt projections.


    If these numbers don’t scare the hell out of you, you are probably Donald Trump or a member of Congress.  


    WHO OWNS THE NATIONAL DEBT?


    Commentators often say we shouldn’t worry about the national debt because we owe it to ourselves. Well, sort of. 

    The total current (December 2025) national debt $38.4 trillion compared to over $36 trillion in 2024. $28 trillion, or about 80%, is owned domestically. About 20% of the national debt ($7.4 trillion) is owned by…the U.S. government! Mostly Social Security and other trust funds and federal employees’ retirement funds. This percent will probably fall over the next ten years as the trust funds of Social Security and Medicare go to zero. About $4.7 trillion is held by the Fed; the Fed is reducing its holdings. Private American investors and institutions own less than half of the total, or $15.2 trillion.


    Foreign lenders own about $9 trillion, or about 25% of the Treasury securities. About half of this is held by foreign central banks and the other half by foreign financial institutions and individuals. Much of this is used to finance international trade. China owns less than $1 trillion of this. The number has been going down; don’t believe the scare rhetoric that the Chinese government could sell all its U.S. government debt and crash the American economy. More is held in “tax haven” (money laundering, money hiding and tax avoidance) countries and banks; the Cayman Islands, a notorious “tax haven,” is now the largest holder of U.S. government debt. It is comforting to know that South American and Mexican drug lords, corrupt government officials everywhere and Russian oligarchs have faith in the U.S government and its dollar.


    The Fed is currently selling off part of its large inventory of Treasuries it accumulated to help finance Covid stimulus programs. So it looks like the federal government will have to sell most of its future debt to private Americans and foreign investors.


    Americans are always complaining they pay too much in federal income taxes. This year, revenue from personal (household) income taxes will be around $2.4 trillion, or about 1/2 of federal expenditures minus Social Security and Medicare.


    FISCAL ACCOUNTING: PROJECTIONS TO 2035

    The projections in this post are from the Congressional Budget Office (CBO), the non-partisan organization that gives Congress figures, analysis and expert advice. These are from January, 2025. They are updated every two years. 


    The CBO projections are probably too optimistic. They are trend projections of existing programs and tax revenue. They assume that events such as recessions, epidemics, wars, or any new spending programs, such as to fight the effects of global warming, will not happen over the next ten years. They assume there will be no further tax cuts. Good luck!


    Based on past experience, it is likely that at least one recession will occur in the next eight years.


    Social Security and Medicare are funded by their own taxes and are working down their trust funds (selling government bonds) that fund part of the benefits. Subtracting Social Security and Medicare taxes and expenditures from the Federal budget, other revenue covers about 80% of all other government spending; the other 20% is the deficit and financed by borrowing.


    I first wrote this post about eight years ago (2017). I update it about every two years. Every time it gets more depressing. When interest rates the government paid on the national debt were very low, no one in the government talked about the rising interest expense and what to do about it. But now with higher interest rates on a larger (and growing) national debt, interest expense has risen and has become a larger part of government budgets. Even if interest rates stay where they are now, in 2035 compared to 2025, the increase in interest expense will about equal the increase in personal income taxes, about $1.8 trillion each. In other words, families will be paying more taxes just to cover the increased interest expense.


    Interest rates on the national debt are likely to rise as the national debt continues to increase more than nominal (taxable) GDP. 


    But still, no serious discussion. I understand why. For 20 years until late 2022, the Fed kept interest rates at very low levels. Among other effects, this was a massive subsidy to the federal government. It kept the cost of the increasing national debt low, below the political radar screen. No elected representative or politician wants to talk about it. The choices to minimize the increase in future interest expenses are political dynamite. Better to blame deficits on welfare payments to illegal immigrants.


    For a detailed and lucid presentation of the current federal debt and the issues involved, see John Mauldin’s essay titled “Debtors and Creditors” at mauldineconomics.com.

    SOCIAL SECURITY


    Even the most conservative projections are scary as more Americans get older (the number of Americans over 65 years old is expected to double over the next 25 years) and the health care industry is doing a really good job of keeping us baby boomers alive longer (mostly paid for with government funds). In addition, part of Social Security expenses comes from past Social Security taxes that are in the Social Security Trust Fund. This fund is projected to go to zero around 2034/5. Social Security benefits will fall at least 20% or the deficit will come out of general tax revenue. This will add about $300 billion to general expenditures and the yearly deficit. With the rising number of senior citizens, who like to vote (about 30% of registered voters by 2035), guess which alternative is more likely. This could be fixed with some relatively minor changes to Social Security taxes or raising retirement ages spread out over 10 years. But so far Congress has totally ignored this large addition to future yearly deficits and the national debt.

    After 2035, when the trust funds run out, we will have fewer workers paying in to support many more recipients of Social Security and Medicare. More of the cost will come out of general tax revenue, leading to even higher deficits.

    YEARLY DEFICITS AND THE NATIONAL DEBT


    The government has benefitted from the very low interest rates engineered by the Fed over the last twenty years. But interest rates began to rise as the Fed quickly raised the Fed funds rate to bring down aggregate demand and the inflation rate in 2022. Of course this had no effect on government spending. Every one percent increase in the interest rate on the national debt will add at least $300 billion a year to expenditures and the deficit. Another way to look at it is that the interest expense in this fiscal year was more than half of the deficit. At current interest rates, total interest expense could be about 60% of the yearly deficit in a few years (as the past lower-cost debt is rolled over) and possibly a higher percent further out. The government is borrowing more money each year to pay interest on past borrowing.


    A combination of rising national debt of over $2 trillion a year combined with rising interest rates would push politicians and us voters even further into denial. So far, everyone wins. We get corporate and household tax cuts. We spend more money on defense and national security than the next nine countries combined. We have generous social welfare, health, and retirement benefits. After paying for Social Security and Medicare with dedicated taxes, we borrow over one-fifth of the total cost of the rest of the budget every year. Even the most optimistic projection indicates that by 2035 all of the income the Federal government takes in will only cover “mandatory” programs (mostly Social Security, Medicare, and Medicaid) and defense. Maybe a part of national debt interest, depending on future interest rates. All of the rest of the budget, all the subsidies and tax loopholes and worthy programs, are funded through borrowing. Who says there’s no such thing as a free lunch program? Party on!

    What is the point of this discussion? Fiscal policy – the size and changes in the size of yearly deficits and government debt – has nothing to do with political philosophy or promoting economic growth and stability. It has to do with lowering tax rates and no one paying the full cost of received benefits and services.

    TRUMP TARIFFS AND TAX CUTS

    A few words about fiscal changes due to proposed programs from the Trump administration and the current budget. 

    The U.S. government received about $100 billion a year in revenue from tariffs before the Trump tariffs. Total tariff revenue could rise by about $250 billion – $300 billion a year, depending on where the final tariff rates end up. This would reduce the projected deficit. If this happens, the higher tariffs of about $3 trillion over the next ten years would offset more than the $2 trillion increase in the national debt increase from the tax cut from the budget bill.

    But not for the wider economy. The extension of the 2017 tax cut mostly benefits upper-income families because they pay most of the income taxes. The tariffs hit all American families. The tariffs are a disguised tax increase. Families will probably pay much of the additional tariffs in higher prices. And more unemployment.  So the combination of the two is an income transfer from all “hard-working” American families to upper-income families and the U.S. government.

    If other countries retaliate, if global supply chains are disrupted, if total investment falls, the chances of a national and global recession go up. Everyone loses.

    THE DECIFIT, TAX RATES, AND TAX POLICY

    Personal income taxes were $2.4 trillion in 2024. They are expected to increase to $4.2 trillion in 2035. Again, the increase in personal income taxes is equal to the increase in interest expense.


    The size of the deficit can also be affected by changes in the income tax rates but only to a limited extent. About 45% of all households pay no federal income tax. Of all the households that file an income tax, about 80% pay more in “payroll taxes” (Social Security and Medicare taxes) than income taxes. The Federal government collects only slightly less revenue from payroll taxes (Social Security and Medicare) than from personal income taxes.


    A high percent of personal income taxes is paid by high income households; they receive most of any personal income tax cut.


    Studies by the IRS show that small businesses and high-income households substantially underreport their income. Large corporations pay substantially less than the statutory rates; some large companies, including GE in the past, paid nothing at all. Large social media companies have moved much of their intellectual property to Ireland, which has one of the lowest corporate tax rates in the world. Warren Buffett’s company pays a lower tax rate than almost everyone reading this post. Many industries have special tax reduction rules, including “depletion allowances” for oil and natural gas drillers. Property developers and commercial property owners are notorious for not paying income taxes.


    The Trump administration, through DOGE, has laid off many IRS auditors. Further cutbacks are in the current budget bill. Given his background, I guess President Trump just does not like the IRS collecting taxes from rich people and tax dodgers.


    FINANCING THE FISCAL DEFICITS:  THE BOND MARKET


    Even as the nominal GDP, and thus the tax base, increases, the yearly deficit exists year after year. The old bonds do not disappear by increased tax revenue paying them off. As the bonds come due (mature), they are retired (paid off or rolled over) with new bonds. Combined with new deficits and debt, the national debt gets larger. And larger. Any political rantings about reducing the national debt is just so much hot air contributing to global warming. (Sidebar – it seems to me that many people who talk about reducing the national debt don’t know the difference between the yearly deficit and the cumulative national debt.)


    Again, the government finances the national debt by selling bonds. Who buys the bonds, and why? American bonds are attractive mostly because they are viewed as the safest bonds in the world. That is, the U.S. government is never expected to declare bankruptcy. Over 30 governments since WWII have partially or totally defaulted on their debt. And not just poor countries. In the 20th century, Russia, Germany, China, Japan and Italy have defaulted on their debt. Lost wars and revolutions do that. 


    If bond buyers perceive that U.S. bonds are becoming riskier, the first reaction would probably be to demand higher interest rates to compensate for the increased risk. 


    There is a fear this year (2025) that the proposed Trump tariff increases might lead to American and foreign holders of the national debt to start selling off U.S. bonds. The increased awareness of the large and rising debt itself increases the risk of holding American bonds. Other reasons are geopolitical. But holding alternative currencies entail the same risks; most of the larger economies have debt/GDP ratios comparable to that of the United States.


    Another reason is that the U.S. dollar is falling compared to most other currencies. Holding dollars means that when dollars are exchanged for other currencies, they buy a smaller amount. That is, they are worth less to foreign holders and global corporations.


    The increases in tariffs, increases the chance of a national and global recession. This would probably increase the U.S. yearly deficit over the projected CBO projected amounts.


    But why does the yearly deficit occur year after year (after year)? Or, as an economist might say, why is it structural and not cyclical as Keynes hoped? After all, total tax revenue goes up most years. If spending stayed the same, each yearly deficit would go down. One day in the Star Trek future, there would be no yearly deficit and a constant national debt. Easy answer: spending goes up and tax revenue doesn’t go up as much as expected because of the political popularity of tax cuts.


    FISCAL POLICY AND ECONOMIC POLICY


    The federal budget and its deficits do not exist in a vacuum. They are part of the overall economy. Budget deficits are not inherently good or bad. When they occur over the growth cycle is important.  

    Government spending is all lumped together in macroeconomics. Yet what governments spend their money on is important. A lot of it is “income transfers,” taking tax money from one group and distributing it to others. Much of it goes to people who are old or sick or poor but also some goes to less deserving folks. Some of the spending should be considered consumption (gold and marble in decorating the White House). Another part is public investment. This part is vital to economic growth and the development of new technology. Government pays for basic research, public health, infrastructure, education and training, financing and subsidizing private investment, and paying for some of the social costs (such as cleaning up toxic waste dumps) of past private investment and production. This does not include the future costs of fighting the effects of global warming; preliminary estimates are very scary.

    Another way of looking at it:  what the spending financed by debt is used for. A major use in the past has been to finance tax cuts. An extreme example was stimulus programs to fight the recession caused by Covid. Almost all of the stimulus money went to all American families in the form of higher income. The idea was that a big rise in total income would lead to a big increase in total spending. Not as much as expected. There was a big increase in total household saving; many American families didn’t need the extra income. This contributed to later inflation and higher interest rates. This is one reason the prices of stocks and houses are now going up.


    What the stimulus money was not used for was investment to increase future economic growth. Some of the money in the bills passed by the Biden administration started to address increased infrastructure needs and the cost of combating the effects of global warming. President Trump, like earlier presidents, wanted Congress to cut back on some of the government’s basic research. It is almost impossible to think of any new technology developed after WWII that the federal government did not help finance and develop, including computers, microchips, jet aircraft, the internet, GPS, digital photography, biotechnology, and autonomous driving. Especially in the early stages of basic research and applied research and development. Developing new technology is the main source of economic growth and thus increases in tax revenue.


    The idea that there is some economically rational fiscal policy is a fiction. Presidents who propose yearly budgets and congress members who vote on them are rational. The want to get reelected and expand favorite programs. They ignore the present and future cost of the yearly deficits they create. Somebody else’s problem. Your children and grandchildren. And, of course, there will be fewer of them to foot the bill.


    Some commentators believe the “debt overhang” of high and rising national debt and its interest expense will be the cause of our next economic crisis.


    ———————————————————————————-


    See the companion post Government Finance 102:  Monetary Policy: The Red Queen’s Race for how the Fed has facilitated the creation of our large federal deficit. For many years, the Fed kept the fed funds rate close to zero; this meant the government could increase borrowing faster than interest expense. Almost free money.

    You might want to pair this essay with the latest population and demographic projections (fewer people, more old people). See

    Demographics, Immigration and Future Economic Growth of the United States


    If CBO trendlines were projected out to 2045, the national debt would be more than $70 trillion. U.S total population and the size of the labor force in 2045 is very likely to be less than now. Retired Americans will be a higher percent of the total population.

    You might be interested in

    Introduction to the Stock Market Crash of 1929 and the Start of the Great Depression


    The CBO assumption that nothing will ever go wrong in the U.S. economy isn’t likely. To be fair, this restriction was put on the CBO by Congress.


    Elsewhere in this blog, I argue that the main form of our economic competition, and geopolitical rivalry, with China will depend on our success in developing new technologies. See


    American Tariffs and the U.S. Economic War with China


    If the United States maintains the current proposed tariffs averaging around 15-20% and because of current economic policies cannot compete with China in global markets, CBO and other economic projections are unrealistically optimistic.


    For a list of all the posts on this blog, see 

    List of Posts by Topic

    with links to all other essays. There are posts on the demographics of other countries and the world as a whole, the Beginning of the Industrial Revolution, American Economic History, and American History. Even posts on finance, business, and economics.
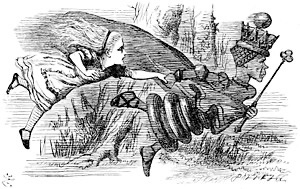
  • Government Finance 102:  Monetary Policy. The Red Queen’s Race

    Government Finance 102: Monetary Policy. The Red Queen’s Race


    The Red Queen’s Race


    TWO DEFINITIONS


    Fed funds rate


    The Fed funds rate is the interest rate banks charge other banks that borrow their excess reserves. It is a very short-term (overnight) rate. An increase in the Fed funds rate increases the cost of capital of large banks (net borrowers) and puts pressure on these banks to raise their lending rates. A change in the rate also changes the rate charged by other sources of short-term funds.


    The Fed funds rate is the most watched interest rate in the United States and probably the world. It is not set by supply and demand in financial markets. It is set (fixed) by the Federal Reserve Bank (the Fed), America’s central bank. 


    The Fed funds rate determines or heavily influences almost all other short-term interest rates in financial markets. It also indirectly influences many other longer term interest rates. It summarizes how the Fed views the economy and near-term changes. It is at the heart of monetary policy.


    Nominal vs. real interest rates

    Nominal interest rates are the reported interest rates, also called current interest rates. Real interest rates are nominal rates minus some measure of inflation. Both nominal and real rates can be negative. For many years recently, nominal interest rates on many countries’ national debt have been negative. No longer. Although almost all countries have raised central bank rates, the inflation rate in the United States and many other countries was above almost all nominal interest rates, making real rates negative. This is no longer true in the U.S., as inflation has come down below the Fed funds rate but the Fed has not started to lower rates. (As of 7/24)


    MONETARY POLICY


    The Fed’s mandate is to make monetary policy. The objectives of monetary policy and the tools the Fed uses to implement policy have changed from the past.  


    In the past, the Fed’s main functions were to fight inflation by raising interest rates and slow down the growth rate of the money supply, and to fight recessions by lowering interest rates. The Fed could also be the “lender of last resort” to banks if the banking system got into serious trouble. Most of the time, however, the economy grew and the Fed had little to do. In the last few years, especially during Covid and after, the Fed has bought huge quantities of federal debt (Treasuries) to keep interest rates low. It is currently slowly selling off its inventory. It is uncertain if the Fed will continue to sell off Treasury inventory when it starts to lower interest rates.


    Although never publicly stated, the Fed seems sensitive to supporting asset prices, particularly stock prices. Bond prices move inversely to interest rates. Rising interest rates lowers prices of existing bonds and raises the interest expense of new debt. The largest single borrower is the U.S. government.


    With the deregulation and globalization of the banking system and the explosion of nonbank financing, the Fed has less direct control of the finance sector than in the past. But as long as the dollar is the international currency and non-bank financial institutions fund their operations by borrowing from banks, the Fed will have indirect influence on the rest of the financial markets. 


    The Fed funds rate is in the range of 5.25-5.50% while the inflation rate is under 3.0%. This has been the Fed funds rate since May, 2022. The Fed started reducing the Fed funds rate to 4.75-5.00% in September. If the inflation rate stays low, this will decrease both nominal and real rates of interest.


    The recent history of Fed policy has been unusual. The Fed under Ben Bernanke and Tim Geithner and the Treasury under Henry Paulson were extremely aggressive during the 2008-09 financial crisis in containing the real threat of a total meltdown of the national and global financial system. They extended loans to and guaranteed debt of banks and non-bank corporations. They promoted shotgun marriages between banks, creating megabanks and accelerating the consolidation of the banking system.  But their policies of historically low interest rates and purchasing of public debt continued long after the economy resumed growing. From 2008 to early 2022, the Fed funds rate has been below 1% in 12 out of the 14 years. This is extraordinary; the last time the Fed funds rate was below 1% was for a short time in 1958. And, during this recent past period, real interest rates were negative. The Fed obviously believed that a massive interest rate subsidy was necessary to get the U.S. economy out of the Covid-caused recession and for continue economic growth.


    A major beneficiary of low interest rates has been the federal government. The government has been able to greatly increase the national debt with little increase in interest expense. Interest rates on government debt before the 2022 inflation, less than 1% on ten-year government bonds, were the lowest they’ve been since the end of World War II. But since 2022, interest expense on the national debt has been rising rapidly and will continue to rise unless there is a large decrease in government borrowing costs. This is unlikely.

    Extremely low interest rates by themselves did not seem to have much of an impact on economic growth rates. But a combination of low interest rates and the corporate tax cuts of President Trump have helped to increase after-tax corporate profits. They have grown much faster than the economy and total income, reaching a record high as a percent of GDP. Over the last 40 years, stock prices have increased faster than wage income. No wonder families with financial assets have seen their incomes grow faster than families without financial assets.


    While the Fed has increased the number of tools it is willing to use, it usually cannot prevent accelerating inflation or a recession. These are often caused by exogenous (outside) events the Fed has no control over. OPEC raising oil prices, Asian and Russian debt crises, Covid, Chinese lockdown policies, global supply-chain problems, war in Ukraine, Russia shutting off oil and gas supply to Europe, disruptions caused by effects of global warming. The Fed is judged on how quickly and effectively it reacts.  

    THE CORONAVIRUS AND MONETARY POLICY


    The Federal government spent trillions of dollars to maintain total income, keep companies and state and local governments from going bankrupt, paying for emergency services and once again backstopping the entire financial system.

    The government’s financial response to the coronavirus was unprecedented in peacetime. Starting with the 2008-10 playbook, the Fed and the Treasury, working together, came up with massive new programs to keep the economy from falling into a prolonged depression, buy time until the virus abated, and guaranteed virtually all debt in the country. In the first round, over $3 trillion will be spent on income maintenance. Congress added another $1.9 trillion in the first months of President Biden’s administration, which will be spent over the next decade.

    All of the government income maintenance programs cost at least $300 billion a month, about equal to the fall in total income. This was extraordinary – a deep recession (fall in total output and rise in unemployment) without a decrease in total income. The economy recovered quickly. There were falling levels of unemployment already in 2021 and near record lows by the first half of 2022.  Since then, the unemployment rate has remained low despite a continuous increase in the size of the labor force.


    The lagged effect of earlier income maintenance programs plus the 2021 “stimulus” expenditures pushed total income above the long-term trend line, resulting in increases in total spending and falling unemployment rates. The inflation rate rose through 2021, reaching levels far above 2% before the Russian invasion of Ukraine and the resulting increases in energy prices. The Fed did not start increasing interest rates until the middle of 2022. But, to make up for a tardy start, it raised rates rapidly.


    The Covid stimulus programs had another effect. Total household liquid financial savings went up by about $3 trillion, about equal to the cost of the programs. Add-on savings from higher income and a stock market boom has kept total liquid savings from declining very much, if at all. In other words, the net financial effect of Covid stimulus programs has been to increase public (federal government) debt offset by increased private (household) savings.


    Assuming a 3% interest rate on the national debt, much of the increase in tax revenue since 2022 will go towards paying the increased interest expense on the national debt. Much of this has already occurred. Interest expense was around $450 billion a year in 2022; it is currently (2024) around $890 billion because of the increase in interest rates. By 2034, interest expense is projected by the CBO to be $1.7 trillion, about double the 2024 expense. By 2034, the increase in interest expense will be abut 60% of the increase in total expenditures minus the self-funding Social Security and Medicare programs. (BTW, the CBO projects that both Social Security and Medicare expenditures will increase about 5-6% a year. I find this hard to believe.)


    For the details behind these projections, see The Congressional Budget Office. (Update as of June, 2024.), especially their Executive Summary.  


    How is the government paying for all this? Borrowing. Selling new debt to cover yearly deficits and rolling over existing debt at higher interest rates. 

    2020-2022

    Much of the new debt created for the Covid programs was financed indirectly by the Fed, that is, the Fed created money to buy the same amount of debt. The Fed also underwrote the risks of virtually the entire debt market, even announcing it was willing to buy junk bonds. Much of the junk bond market consists of bonds issued by frackers who were in danger of going bankrupt because of low oil prices. The government would loan money and provide assistance (guarantee corporate debt) to companies in danger of going bankrupt.

    2022 and 2023:  FIGHTING INFLATION

    All U.S. government fiscal and monetary programs in 2020 and 2021 were aimed at countering the sudden recession and economic dislocations caused by the Covid epidemic. But throughout 2021, the Fed was ignoring the financial effects of the stimulus programs financed by Fed’s buying of the rising national debt and massive expansion of the money supply.

    The Fed has stated for a long time that it will tolerate an inflation rate of 2% but will be concerned if the inflation rate goes above 2%. The inflation rate started to go above 2% in March, 2021. It rose steadily to 7-9% by the end of 2021 (depending on which measurement was used). The unemployment rate fell rapidly, reaching 4% by the end of the year. The unemployment rate has been below 4% since 2022. This is close to what economists consider full employment. Until March, 2022, the Fed continued to purchase large amounts of U.S. government debt.

    The $1.9 trillion stimulus program of March, 2021 was “a bridge too far.” A smaller program was probably needed to continue the recovery. The problem was the size. If you (or Fed economists) added the creation of new income to the trend in total income due to the rapid increase in employment and wage income, the total was greater than the amount of total income leading to full employment. That suggested that sometime in the foreseeable future (the Fed’s planning horizon), the inflation rate would go up, well past 2%.

    Even with the inflation rate around 7% at the end of 2021, the Fed didn’t react. The Fed funds rate was still around zero.  The inflation situation was made marginally worse by Russia’s invasion of Ukraine in March and the rise in energy prices (since reversed, at least the U.S. price of crude oil). Not until May, 2022, did the Fed start getting serious about raising the Fed funds rate and stop increasing its holdings of government debt. The Fed raised rates rapidly to make up for its delayed reaction to high inflation. They raised rates even while the inflation rate was coming down.


    MONETARY POLICY AND MACROECONOMICS

    The Fed made it clear they would keep the Fed funds rate high until the inflation rate would show a substantial downward trend towards 2%. Back to the old-time religion – fight inflation come hell or high water! Don’t support any aggressive fiscal policy to fight a possible recession that might result from rising interest rates. In fact, the Fed, to support higher Fed funds rates, has been selling its holdings of government securities to reduce the money supply. This risks the possibility of a recession before the inflation rate falls below 2%.

    The Fed could get lucky. Many commodity prices are falling, which might counter some of the increased wage and salary costs. Shortages due to global supply chain dislocations started to clear up. Almost all large corporations are saying they are “increasing free cash flow,” a nice way of saying they are slashing costs. A recession might lead to a moderate increase in measured unemployment because the labor force is growing at a much slower rate than in the past. Fewer than expected new entrants. So small increases in the unemployment rate, as are now happening, do not seem to influence the Fed to lower the Fed funds rate. 

    If the price index as measured by some version of the CPI stops going up but stabilizes at the current high levels, the year over year inflation rate will go down. Why? Because the price level – the inflation rate – rose rapidly in the second half of 2021. The same current price level will be divided by increasingly higher past price levels, resulting in a lower yearly inflation rate.

    Leads and lags again. Don’t “follow the data,” which is past news. Since there are lags in reporting economic data and the Fed has to look at trends and averages in the data, it will usually be behind the current and near future data. If there is large and rapid increase in the data, as recently, the Fed has to make up its delays in policy changes by large and rapid changes in instruments like the Fed funds rate. Anticipate the future and build in lags in the impact of policy changes. Like everyone else making financial decisions, the Fed should forecast the future and place its bets. As my old econ prof used to say – you puts down your money and you takes your chances. 

    The Fed should have anticipated that an aggressive monetary policy supporting massive fiscal stimulus to fight the disruptive recession caused by Covid could led to higher inflation rates if taken too far. As it did, the Fed should have started fighting the resulting inflation earlier, before it accelerated and raised inflation expectations. Large, delayed increases in the Fed funds rate chasing higher inflation rates now runs the risk of impacting the future economy as it enters a recession. To continue with cliches – the Fed gets the devil and the deep blue sea at the same time. 

    CONCLUDING REMARKS

    There are indirect effects of the Fed’s monetary policies. Very low interest rates, money creation, bailouts to avoid company bankruptcies, and massive bond buying to avoid debt defaults all directly or indirectly helped stock prices. Asset prices increase while the real economy has falling inflation. But the 2021-22 inflation and rise in interest rates temporarily reversed asset price increases, especially stock prices. Since then, the stock market has had a strong boom, fueled by AI stocks (especially Nvidia) in addition to general rising corporate profits and speculation in crytocurrencies. The increased return on bonds does not seem to have diverted demand for stocks.


    In short, the Fed bought massive amounts of private and public debt and paid for it by creating money. The federal yearly deficit is structural; unless there are radical changes in government spending and/or tax rates, the yearly deficit will continue and the national debt will increase.

    This is short-run Keynesian economic policy on meth. Massive income maintenance through deficit spending. This is unlike government spending in the Great Depression, when some of the government spending led to public investment and new jobs – WPA, PWA, CCC, TVA, dams, rural electrification. The recent infrastructure bill provides potential tax subsidies to private investment in designated industries, particularly public investment, domestic chip production and renewable energy. Even before passage of the bill, large, global chip designers and manufacturers announced investment in new plants in the United States.

    This is also Modern Monetary Theory on steroids – run large fiscal deficits and have the central bank (the Fed) create electronic money to buy the government debt. Keep interest rates low, preferably near zero, so the federal government can continue to run larger and larger deficits with small increases in the total interest expense on the national debt. The government has been doing this for years; only the high inflation rates forced the Fed (and financial markets) to increase interest rates.

    There is research done by Carmen Reinhart, Vincent Reinhart, and Kenneth Rogoff that when government debt rises above 90% of GDP, economic growth slows down. Government debt held by the public is already above this ratio. The CBO projects the ratio will be 122% in 2034. 

    What if the causality is the other way? Or there are feedback effects? What if slowing economic growth and low rates of inflation mean a slowing growth rate in taxable income? In the “everybody wins” fantasy of democratic politics, it is difficult to control total spending or to refuse tax cuts or tax breaks. Rapidly rises expenditures for Social Security and Medicare because of an aging society is increasingly paid for out of general tax revenue. Payroll tax rates for Social Security and Medicare might not rise. When the Social Security Trust Fund goes to zero in the mid-2030s, about 20-25% of Social Security expenditures will come out of the general budget. This could add about $300 billion to yearly deficits. 

    Total tax revenue for the rest of the decade will only cover Social Security, Medicare, interest expense, government pensions and social welfare programs like Medicaid and food stamps. The rest of the budget – defense and discretionary spending – will be paid for out of borrowing. Borrowing more money is politically easier than “fiscal discipline.” Surprisingly, the CBO is projecting that short-term government borrowing rates on national debt will go down, but longer rates will stay about the same. This implies that average rates will decrease and the inverted yield curve will disappear.

    All of these fiscal and monetary trends can go on for a long time but not forever. Japan has been doing this since the early 1990s, soaking up most of the country’s past savings to fight off a stagnant economy, deflationary pressures, an aging population, and lack of any structural reform. Japan has had very low rates of economic growth over the last 30 years; I doubt if the U.S. economy and society could tolerate very low growth rates over a long period of time.

    The U.S. can continue running large budget deficits as long as the dollar is the international reserve currency, interest rates decline from current levels, and U.S. government debt is considered risk-free. Or if the growth rate of national debt is lower than the growth rate of nominal GDP. Currently, interest rates on the national debt are trending higher as the government rolls over the existing debt and attempts to attract buyers of the large amount of new debt.

    In the past, conventional wisdom said that fiscal policy and monetary policy had contradictory goals. Fiscal policy was supposed to encourage and support economic growth and job creation. Deficits would increase if there were a recession or low economic growth. This was in the personal interest of elected officials. But too much stimulus or for too long could lead to higher rates of inflation. The Fed would then raise interest rates until inflation rates eventually came down. This would slow down spending and risk a recession.  But over the last 30 years or so, the two institutions seem to be coordinating their policies. The government now has structural deficits rather than a counter business cycle (Keynesian) strategy. The Fed has a bias towards low (below market) interest rates, which also encourages borrowing and increased aggregate demand. Only if the inflation rate rises to a level that threatens growth will the Fed be aggressive in raising rates. So the CBO can project real growth, rising national debt, and falling government borrowing rates from the current levels. Even as the national debt/GDP ratio rises. Again, this might go on for a long time, but not forever. 

    ===============================================

    See companion post Government Finance 101:  Fiscal Policy. Alice in Wonderland.

    For a list of all posts on this blog, see List of Posts by Topic with links to all other posts.


  • THE CONGRESSIONAL BUDGET OFFICE (CBO) FORECASTS THE FUTURE


    At current tax rates, in every year over the next 10 years, the deficit – the increase in the national debt – will be greater than the increase in revenue.

    All the increase in revenue will just pay for the increase in interest expense.


    CBO forecast is probably optimistic. By law, the forecast cannot include a recession or any other unusual adverse event like future viruses. Based on past experience, it is likely that at least one recession will occur in the next eight years. In addition, the Trump tax cut is set to expire in 2025. If it is renewed, this will add a few trillion to the forecasted deficit and national debt.


    The forecast was made before the new Biden administration spending programs were passed and student debt forgiveness was announced. The spending bills indicate that the cost of switching to renewables, modernizing the electricity grid, and decarbonizing is going to be very high in the future. Related, the cost of containing the consequences of past emissions and pollution will also be high. Defense spending will probably be higher than projected because of the need to rebuild weapons inventory and accelerate the design and production of new weapons systems.


    The Fed owns government debt – bonds and government-backed mortgages – and receives interest income. After expenses, the net interest income is returned to the federal government, reducing the interest expense on the national debt and the deficit. From 2010 to 2021, the Fed returned over $1 trillion in interest payments to the Treasury. 


    The Fed has financed the stimulus spending bills by creating electronic money. At the beginning of 2020, Fed holdings of various forms of government debt was $4.2 trillion. As of August 17, 2022, the total was $8.8 trillion. $3.8 trillion was balanced by reserve holdings by bank deposits. The Fed now pays floating-rate interest on these deposits. But interest rates on assets are fixed until the bonds or mortgages mature. The cost of this new debt appears fixed at low rates but is actually determined by changing short-term interest rates on bank reserve holdings. So a rise in short-term interest rates cuts into the Fed’s net income and remittances to the government. If short-term interest rates stay high or rise, the Fed’s net income could disappear or even turn negative. The government’s interest expense is higher and deficits larger.


    The Fed can reduce its holdings, and interest expense, by selling off government debt. It is currently doing this. But the government must replace this debt with new debt at higher interest rates, again increasing net interest expense and larger deficits.


    Eventually, the U.S. government will only be able to finance all of its programs with structural deficits, rising debt and probably higher debt/GDP ratios, and higher interest rates. I would not like to be a member of the CBO committee that makes economic projections in 2030.