I was, for many years, in charge of finding and analyzing acquisitions for a large company. Then, for two years, I was an independent merger broker and took part in negotiations.
MERGERS AND ACQUISITIONS
American corporations spend over $1 trillion a year buying other companies. This is more than they spend on net new investment (minus data center investment). Even more than they spend on boxes at pro sports stadiums.
Buying another company is a risky corporate strategy. The few studies I have read indicate that 70-80% of acquisitions are failures. They do not earn the acquirer’s opportunity cost of capital. Many are a total loss and result in future write-downs.
This failure rate from published research is similar to the information I collected. My department would use discounted cash flow/net present value analysis to determine the maximum price we would pay for an acquisition (the present value of the future net cash flows). We kept a running list of companies that were potential acquisitions. Most were eventually acquired by other companies. A high percent, over 80%, were acquired for a price above our maximum price.
Because of the high risk of an acquisition, we were probably conservative in our forecasts of future cash flows. As a check, we did sensitivity analysis and learned that the present value of a company was sensitive to small changes in sales growth rates and operating margins.
Why such a high failure rate?
The first reason is that the buyer pays too much, making it unlikely the buyer can earn an acceptable return on the investment. Many of the acquisitions were of public companies. Finance theory says that the current price is the best estimate of expected future cash flows. Yet acquiring companies routinely paid 30%-60% over market price. Why?
Usually, the acquirer goes after the acquired. This gives the seller a negotiating advantage. If they are smart, they will appear reluctant to sell, hoping to be “convinced” to sell at a high premium.
From a seller’s viewpoint, the best situation is when two or more acquiring corporations get into a bidding war. Financial rationality goes out the window. Remember, companies are headed by people who are very competitive. They don’t like to lose. An auction starts. The winner often pays too much and learns about another concept – “winner’s regret.”
This can happen even if there is only one bidder since the seller doesn’t have to sell. The seller can hold out for a very high price, knowing that once the company is “in play,” other potential acquirers will become interested.
If the intended acquisition is a public company, the acquirer has to pay some premium to ensure all or almost all of the stockholders sell their stock. Another reason is that the acquiring company may believe the acquisition is worth more to them than to outside investors. Maybe the company has a key technology or specialty product the acquirer needs. Maybe the acquirer could bring something that would add value to the acquired, such as wider distribution of a regional or specialty consumer product. Maybe the acquirer is eliminating an actual or potential competitor.
Maybe the acquisition is highly valued because of the entrepreneurial management the acquirer lacks. Wal-Mart paid over $3 billion for a small online retailer that was losing oodles of money. A look at Wal-Mart’s e-commerce site will tell you why. Wal-Mart bet $3 billion and billions more in the future that the founders and managers of jet.com knew how to compete with Amazon.
These are potential added benefits compared to the current cost of the acquisition. They are uncertain. Acquisitions are risky for another reason, summed up in the concept of asymmetric information.
ASYMMETRIC INFORMATION AND ACQUISITIONS
Who knows more about the intended acquisition, the buyer or the seller? The seller. Why? The seller knows the risks, where “the bodies are buried.”
The buyer will try to discover the risks through a process called due diligence. The seller must make its financial records available to the buyer. But financial records seldom indicate the risks. The buyer’s owners and managers have no incentive to divulge any adverse information; on the contrary, they have a strong personal incentive not to divulge negative information.
The seller knows more about the company and also more about the industry – the competitors, the technology and future sources of risk.
POST-ACQUISITION RISKS
Imagine that you and your friends started a company. You worked very hard – 12-14 hours a day, 6-7 days a week – and ploughed profits back into the company. You took modest salaries. The company grew rapidly. One day there is a knock on your door. A large corporation wants to buy your company. The price will make you and your friends rich. Seriously rich. Now what happens?
You and your management team are now managing a small piece of a large company. Rather than running the show yourself, you now report to a Senior VP in a big city far away. There are budgets, reports and meetings. Proposed capital expenditures now go through a long, formal process; you compete with other parts of the corporation for capital. Clueless corporate staff types with MBAs from Harvard review your requests and decisions. High-risk proposals are denied. After a few years of this, what do you and your friends do? Walk. The main reason the large corporation bought you, what made you attractive, just walked out the door, taking most of the value of the company with you.
This scenario is very common. Even a less drastic scenario is likely. Do you work as hard? As many hours? Don’t you want to enjoy your new-found wealth? Buy the Porsche you always dreamed about and zip down the Pacific Coast Highway to Big Sur for enlightenment? Go to comic book conventions? Maybe divert your attention into pursuits that bring you status? Part-owner of a professional sports team? Board membership at a prestigious museum or orchestra? A vineyard in Sonoma Valley? The new possibilities are endless.
And the ultimate nightmare to the acquirer. You and your friends get to hate your corporate superiors and their petty, bureaucratic mentality. So you walk out and start another company in competition with them. You have tons of money, a proven track record and every VC in the Valley wants a piece of your new company. You know everything about your old company and its owners know nothing about your new company. Asymmetric information is still your ally.
Mergers and Acquisitions (M&A)
In addition to the development of innovations and internal growth as a source of growth for corporations and the formation of oligopolies, large corporations are often formed through mergers and acquisitions.
“Merger Mania” in the late 19th century, often promoted by J. P. Morgan and culminating in 1895-1904, created many of America’s largest companies. Many would continue to dominate their industries well into the late 20th century.
One indication of the continuing impact of mergers among large companies and acquisition of smaller companies is the decrease in the number of publicly traded companies. In the mid-1990s, there were around 8,000 publicly traded companies in America. In 2016, the number had fallen to 3,627.
For many years recently, America’s corporations have spent more than $1 trillion a year on mergers and acquisitions. Globally, M&A is around $3 trillion a year. Some of the largest mergers recombined companies that were broken up in earlier anti-trust cases. Cross-border and cross-regional mergers and acquisitions are creating global companies, called multinational corporations (MNCs).
The result is increasing concentration. Two finance professors at the University of Southern California estimate that nearly a third of American industries were highly concentrated in 2013, up from a quarter of all industries in 1996.
Many of America’s 500 largest corporations spend more money every year on mergers and acquisitions than on net capital investment.
Why? What are they buying?
Some mergers are between large corporations to reduce combined costs, reduce competition, merge related product lines or realize some economies of scale. Many large companies acquire smaller companies to eliminate potential competition, acquire new technology, acquire more innovative managers and employees, expand product line, or expand markets to other countries. While the United States and other countries have anti-trust laws, they are seldom used to block mergers or acquisitions. Governments often tolerate or even encourage mergers, believing larger companies are necessary to compete in regional (EU) or global markets.
While most merger and acquisitions do not make financial sense – they do not earn the companies’ cost of capital – they may make sense from a strategic point of view by eliminating actual or potential competition.
Acquisitions of competitors or new companies that have specialized knowledge or are perceived as a current or potential threat is another defensive strategy to preserve market positions over time. Acquisitions, seldom a good investment, are the cost corporations pay for stability and long-term survival. Pharmaceutical companies, rather than buying small drug companies, often advance funds to a company with a promising new drug for development and FDA trials. In exchange, the large drug company is given marketing and sales rights, and a percent of future sales or profits.
AI Financing: The New M&A
There’s a rush to invest in AI, and NVIDIA is one of the main actors. Microsoft, Oracle, xAI, Intel, Advanced Micro Devices (AMD), CoreWeave, Mistral, and OpenAI are all nodes of an increasingly interconnected web of AI-related transactions. These deals transcend the usual merger or acquisition, and probably avoid antitrust scrutiny.
I call these “circular deals,” where a big tech company takes equity in or provides credit to a customer in lieu of cash for its equipment or services. Such deals require convoluted financial engineering that are difficult to analyze, often hiding risk. Ed D’Agostino, “We’re Back to 1997/98?,” October 31, 2025.
Nvidia and other companies are creating technological ecosystems.
Nokia recently received a $1 billion equity investment from NVIDIA, securing its place in the coming telecommunications 6G build out.
The new strategy is to negotiate joint strategies along the supply chain without a formal acquisition or merger. Some of the cost of the new data centers is off-loading onto private credit firms and do not appear on the balance sheets of the big tech companies. Since high-tech companies are the favorite targets of anti-trust departments, these strategies may avoid government anti-trust lawsuits.
OpenAI strikes a huge deal with Amazon. The ChatGPT maker agreed to buy $38 billion worth of cloud computing capacity from the tech giant over seven years, days after it renegotiated its relationship with Microsoft partly to reach such agreements.
If you don’t know the background of this complicated story, you might want to first read a shorter version that introduces some of the key factors explaining the Crash and the Depression. See,
Before reading this essay, I strongly recommend you see the PBS video on YouTube. Type in Stock Market Crash 1929. Look for US – The Crash of 1929 (PBS), ALLHISTORIES – PLAYLIST.
Documentary broken into 6 parts to show commercials. Or buy the video on Amazon Prime. Great documentary with wonderful photos, videos, and scenes from movies of the 1920s and the crash. Shows what a crazy time it was.
The video is also a great introduction to Andrew Ross Sorkin, 1929: Inside the Greatest Crash in Wall Street History – and How It Shattered a Nation. This book concentrates on the roles played by a small number of key men; the video also focuses on these men and their social environment.
The following quote that introduces this essay is from Mr. Sorkin’s book.
The stock market is a mirror whose function it is to provide an image of the underlying or fundamental situation. Cause and effect run from the economy to the stock market, never the reverse. An unstable economy can be disturbed by all kinds of incidents that on the surface appear extraneous.
Jesse Livermore
Famous stock market speculator
INTRODUCTION
The usual reason given for the Great Depression – the stock market crash in October 1929 and the later collapse of the banking system – does not tell the whole story. Available economic data (there were no national income accounts in 1929) indicate that a recession had already begun before the stock market crash. The crash of October and November of 1929 was a catalyst that made the recession worse, but the partial stock market recovery in early 1930 did not end the recession. Industrial production continued to fall quickly and unemployment rose rapidly in 1930. As the economy sunk lower into depression and unemployment reached catastrophic heights, continuing farm and businesses failures over the next two years wiped out thousands of small rural banks and threatened total financial collapse in early 1933.
For a fuller explanation, we have to go back to the 1920s to see additional reasons for the stock market crash of 1929 and the rapid decline in output at the beginning of the Great Depression. We have to look at the international financial situation and how it contributed to America’s depression, including the attempt after World War I to reestablish the pre-war gold standard.
Economic Growth in the 1920s: Industrial Production and the Real Economy
There was a spectacular increase in industrial production starting in the 1870s and continuing into the 1920s. The 1920s were a decade of economic growth and development. The large increase in manufacturing output in this decade was driven by innovation in new and greatly expanding industries and companies.
The structure of the economy changed in the 1920s, with consequences for the stock market and financial markets in general. Industrial production, especially of large corporations, were a larger and more important part of the total economy. In contrast, agriculture stagnated in the 1920s. In 1920, agriculture accounted for 18% of Gross Domestic Product (GDP, a measure of total output); by 1929, agriculture’s share had fallen to 12%.
The foundations of the new economic structure were corporations building large-scale manufacturing plants with electricity replacing steam as the power source, new steel machinery, lower transportation and information costs, increased productivity (output per worker), and lower unit cost.
The drivers of economic growth were the new and developing technologies.
consumer durables, especially autos, electrical appliances, and radios.
electricity utilities.
mass communication (phones) and entertainment (radios, phonographs, movies).
mass-produced consumer nondurables such cosmetics, toiletries, processed food, and cigarettes.
Steel was the basis for the new auto industry, modern machinery, and skyscrapers. The amount of railroad track increased eight times from 1870. Thousands of miles of paved roads were built in the 1920s. The telephone system became ubiquitous and transcontinental with an increase in transmission bandwidth.
The 1920s was a decade of economic growth and development but it was uneven. It began with a severe deflationary (prices going down) recession as the economy adjusted from the World War I wartime economy to a peacetime economy. Economic growth began in 1922. The stock market grew rapidly in 1922 and 1923, and kept growing until late in 1929. But in 1927 and 1928, the economy hardly grew at all. Growth for the two years was about 1% per year. One reason for the 1927 stagnation was the bursting of the Florida land boom bubble (in video). This bubble showed large numbers were willing to speculate on something they knew nothing about but thought they would get rich quick. (See Marx Brothers movie Cocoanuts. Groucho was wiped out by the market crash. The movie, ironically, was released in 1929.)
Another reason was the total shutdown of Ford in 1927. Henry Ford finally scrapped the Model T and retooled his plants to produce an entirely new auto. He laid off 60,000 workers. There were spillover effects on other major industries such as steel, tires, and glass. Full production was not reached until 1929.
But strong economic growth returned in 1929. The annual growth rate was 6%. Industrial output grew faster. This strong growth was led by increased production of autos, radios, electrical appliances, and new consumer goods.
The economic expansion of 1921-1929 was based on the development of new technologies like radio and the expansion and sales of consumer durables like autos. The urban and regional buildout of the electric grid (and lower rates) led to demand for new electrical appliances and large productivity gains in mass production. Car ownership increased from about 7 million in 1919 to 27 million in 1929, on average about one car per household. This created demand for complementary products and services such as steel alloys, refined oil products, gas stations and mechanics, paved roads, and motels.
Radio (RCA) and others went from selling hobby kits in 1919 to sales of $60 million in 1922 to sales of $426 million in 1929. (Figures on car and radio sales are from digital history.uh.edu, “The Consumer Economy and Mass Entertainment.”)
Auto production was an important part of the industrial economy in the years leading up to the stock market crash. The auto industry produced approximately 4 million cars in 1926, fell to 3.1 million in 1927 because of the Ford shutdown, recovered in 1928, and reached a record 5.4 million in 1929.
Sales of these products was greatly enhanced by a large increase in consumer credit. General Motors started its own credit operation in 1919. Sears quickly followed by offering installment plans on appliances and other products. (Singer Sewing Machine Company started an installment payment plan in the 1800s.) Hundreds of new consumer credit companies were started in the 1920s.
New industries were created or greatly expanded in new types of passive entertainment (movies and phonographs) and mass consumption products like packaged food, cigarettes, toiletries, and cosmetics. Marketing and advertising encouraged consumption.
Economic growth and industrial production helped to create and expand a new middle class including managers, engineers, accountants, and lawyers. So did the expansion of the financial sector. This middle class had rising income and savings. They provided many of the new speculators in stocks in the 1920s.
Industrial Corporations and Stock Markets
Starting in the late 1800s, new and rapidly-growing industrial corporations needed large amounts of investment and expansion capital, far more than what they could generate from internal cash flow. Capital was needed to take advantage of scalability (economies of scale).
The stock market, and the financial sector in general, had become increasingly important to the American economy during the 60 years leading up to the crash of 1929. In the 1920s, the financial sector doubled as a percent of the national economy. Its growth paralleled the financial requirements of new and growing companies. New, capital-intensive, large, and growing corporations needed investment capital far in excess of what company founders and rich backers could provide. The solution was the creation of the publicly financed, limited liability corporation. The canals starting in the 1820s, the railroads starting in the 1830s and then the industrial corporations starting in the 1870s issued stocks and bonds to the public to finance their capital requirements. In an expanding economy, investors could expect to collect dividends and watch their stocks appreciate in price.
Equity capital (stock) had the advantage over bonds that the corporation was not obligated to buy back the securities. Or pay a fixed amount of interest. But investors were “locked-in.” This might have limited the attraction of equity investment except that investors in public companies could exit by selling their stock to others in “secondary” markets like the New York Stock Exchange (NYSE).
So large companies and stock exchanges were connected, complementary, and grew together.
The Stock Market Crash of 1929
In the 1920s, the “stock market” meant the New York Stock Exchange. This is where the shares of most large companies were bought and sold.
The New York Stock Exchange was a private company, owned by its members. Until the 1920s, most stock traders were full-time professionals. There were no rules or laws. Traders lied, cheated, and deceived among themselves. In the 1920s, they could now also do this to naïve small investors. They viewed small investors as sheep to be shorn.
In 1929, there were 1,334 companies whose stock was traded on the New York Stock Exchange. This was a tiny percent of all the farms and businesses in America. But these were most of America’s largest companies. They accounted for much of the economic growth in the 1920s.
Many of the companies on the NYSE dominated their industries and markets. They had exhibited large increases in sales and profits over time, which led to high expectations for rapid future growth in company sales and profits.
The impression that “everyone” was playing the stock market is an exaggeration. By 1929, fewer than one out of ten families had money in the market. They were about half of all families with financial assets. Stocks, like consumer durables, were often bought on credit, or “margin,” by some of the speculators. About half of small investors bought on margin. Typically, the investors put up 10 – 20% of the value of the stock and borrowed the other 80 – 90% from the broker. The stock was collateral for the loan. The broker, in turn, borrowed the money from banks and other institutions with spare cash. Brokers’ loans (also known as “call money” because they were overnight loans and could be “called” in one day) increased about $1 billion in 1920 to $4.4 billion in early 1928 to $8.5 billion in October 1929.
About 80% of the brokers loans came from sources outside the banking system, including overseas, so Fed pressure on member banks not to make call loans had little effect. The loans seemed safe as long as the stock collateral increased in value. Interest rates were higher than alternative short-term loans.
Small investors leveraged their bets even more by using margin to buy stock in new investment trusts. Investment trusts were similar to today’s mutual funds except they were also leveraged – selling both shares to investors and floating bonds. Then leveraged investment trusts bought shares in other leveraged investment trusts. Alas, leverage also worked on the downside; owners of shares in investment trusts were wiped out even when the shares of the underlying companies still had some value.
The speculative bubble, when stock prices rose much faster than earnings and earnings per share, began in March 1928. As measured by the Dow Jones Industrial Average, stock prices doubled and reached an all-time high the day after Labor Day, September 3, 1929. The Dow Jones index went from 200 to 390. The total value of stocks had gone from $25 billion to over $50 billion, in an economy of $100 billion.
By 1929, investors had high expectations about the percent increase in stock prices. Based on the yearly increases from the beginning of 1928 to September 29, conservative investors who paid cash and bought a diversified portfolio of stock like the Dow Jones index, expected returns of 50%/year. If they bought stock on 20% margin, they expected to make over 200% a year; on 10% margin, over 400% a year.
Investors who bought leveraged investment instruments like investment trusts with margin expected an even higher yearly return.
Speculators bet on companies like Radio (RCA). RCA was up 500% since beginning of 1928.
There were also short-term bets based on rumors about big pools of capital going into a stock. Often a big speculative pool started buying a stock. They paid for a lot of publicity, including bribing financial journalists to hype their stock. As more small speculators piled in, the pool started selling. Small investors were left holding a bag of stocks with rapidly falling prices. (See video)
While corporate profits were going up, stock prices were going up even faster. This led to record high stock price/earnings per share (P/E) ratios. This was viewed as an indication of rising confidence that the market would continue to go up. But the market’s P/E ratio would have to continue to rise if the market continued to go up at 50% a year.
The Dow Jones index reached its high on September 3, 1929. The market slowly declined for a few weeks and then crashed at the end of October. The market was down nearly 13% on Monday, October 28. The climax, in massive volume, was the next day, October 29 (Black Tuesday), when the market fell 12%. The total drop from its September high to the end of October was 40%.
By the end of November 1929, the stock market had fallen 50% and had wiped out all of the speculative gains since early 1928. In early 1930, it reversed direction and regained 40% of its 1929 losses. Volume was high. But in April commodity prices started to fall again. Industrial production continued to decline all through 1930. Unemployment rose quickly. The market turned down again. By late 1930, the stock market had fallen below its November 1929 lows.
The entry of large “pools” of outside speculative capital and small investors into the stock market was one reason for the bubble. This was something new; until the 1920s, stock market participation was an insider’s game of professional speculators. But now insiders and investment managers of outside capital could manipulate stock prices at the expense of small investors.
Partners of the largest investment banks, market analysts, government officials, congressional committee hearings, and Fed officials had private doubts or warned the public of the dangers of the “over-priced” market. But their messages were drowned out by reassuring and optimistic statements of market boosters like Charlie Mitchell of National City Bank who had done much to encourage margin buying by new small investors. Negative comments were ignored by speculators caught up in the frenzy. Instead, they listened to advisors like the foremost astrologer of the day, who predicted the market would go up forever. Presumably to the stars (see video).
The stock market crash of October 1929 did not come as a surprise to everyone. Some of the biggest speculators like Jesse Livormore and investment bankers like some of the partners at J.P. Morgan sold their positions before the crash. Livormore shorted the market (bet it would go down); when he came home on the worse day of the crash, he told his wife he had made more money that day than any other day in over 20 years of speculating.
Before World War I, about a half a million shares were traded on a typical day. In 1928 and 1929, volume was rising rapidly, averaging about five million shares a day. On October 29, volume hit an all-time high of 16 million shares. Stock prices were on average six times higher than earlier in the 1920s, so that the combination of more speculators, and more of them acting like short-term traders, led to a huge increase in the dollar value of the stock market.
Investors’ and large speculators’ margin of 10%-20% was wiped out in just two days, October 28 and October 29. Margin calls for more cash went out; if not provided immediately, the broker tried to sell the underlying stock, increasing supply. Banks and other providers called their loans. All this led to a cascade of hitting stop-loss orders and more margin calls. In the fall of 1929, about $2 billion of brokers’ loans were pulled out or wiped out.
Large investment pools, like the one controlled by Billy Durant (who put together General Motors and then drove it into bankruptcy), speculated on margin and also lost heavily in the stock market crash. When stock prices fell, they doubled down – buying more stock – only to see their losses increase. Durant personally lost $18 million. One of the richest men in America (on paper) in 1929, he never recovered and finally declared personal bankruptcy in 1936. Jesse Livermore, probably the most successful individual speculator in the 1920s, made a series of bad bets in the 1930s and committed suicide in 1940.
The large, sharp decline in the stock market had an immediately negative impact on aggregate (total) demand, especially demand for consumer durables usually bought on credit and luxury goods and services. Expectations of rising personal wealth and a higher standard of living from rising stock prices were shattered.
After the bubble burst, the New York Fed reacted quickly. In the six months after the crash, the New York Fed injected $500 million of liquidity into the banking system. It cut its rediscount (loan) rate to banks from 6.0% to 2.5%. New York banks, in response, took over $1 billion in brokers’ loans. No major New York bank failed. The market rallied in the first half of 1930. It appeared the crash had been contained. It wasn’t.
It was not because of:
the weaknesses in the American economy, especially the farm sector.
the fragile international financial system, based on the gold standard, constructed after World War I.
the fragmented American banking system watched over by passive regional Fed banks.
the rising importance of the financial sector, and how it interacted with the real economy.
The Farm Economy
The period from the mid-1890s to 1918 has been called the “Golden Age of American Agriculture.” Expansion into new areas, rising demand from American and European urban areas and industry, rising prices, and World War I (large food exports to England) all led to prosperity for the farming sector.
In addition to the usual seasonal loans, farmers went deeper in debt to expand acreage (the average size farm increased) and buy large amounts of new equipment, including tractors, to increase productivity and lower unit cost. They also bought new cars (mostly Model T Fords) with borrowed money. During this period, thousands of new banks were started in rural areas to finance this expansion.
Agriculture was still a major part of the economy. In 1920, the farm population was 30% of the total U.S. population. Almost 50% of Americans lived on the farm or in towns with fewer than 2.500 people, many of them in rural areas dependent on agriculture.
The farm economy went into recession during the price deflation after World War I and remained stagnant during the 1920s. Farm prices fell in half after World War I and then slowly declined as American farmers lost their European markets. European demand fell because of the violence, chaos, and disruption caused by the war.
Attempts by the Hoover Administration to stabilize farm prices through purchasing surpluses failed. In 1930, the market price of wheat fell in half. Further large decreases after 1930 in farm prices and the “Dust Bowl” collapsed the agricultural sector, farmers defaulted on loans at a rate of 1,000 a day, resulting in the bankruptcy of thousands of small, rural banks.
Eight rural states set up deposit insurance programs before and during the 1920s. All failed by 1929. Depositors (savers) were ruined along with the banks since there was no federal deposit insurance before 1933.
Large industrial corporations created and dominated markets. The raising of large amounts of financial capital fueled buying the more efficient capital equipment and industrial expansion. Large industrial companies employed factory workers, office workers and new types of professionals like engineers, chemists, accountants, and managers. Combined with the stagnation of the rural sector, America became an urban, industrialized society.
Investors in corporate stock did not always understand why stock prices were rising. Mass production processors and assemblers had high fixed costs in capital equipment. Some of it was financed with debt, creating financial leverage. Companies had to run at a high percent of rated capacity to make a profit. A small increase in sales (output) resulted in a leveraged increase in profit. Stock prices rose with rising profits; expectations of future increases in profits led to higher stock price to earnings (P/E) ratios, also increasing stock prices. This worked in reverse, starting in late 1929. Decreases in sales led to leveraged decreases in profits. Stock prices fell. Expectations of further decreases in profits lowered P/E ratios causing even lower stock prices.
Real incomes rose in the 1920s. But, like today, income and especially wealth was concentrated.
One estimate is that about one-third of all income was going to the top 5%. Sales of luxury goods and services soared. In contrast, farm families experienced a fall in total real income.
Demand for many consumer durables was partly paid for with a large increase in consumer debt called installment loans (buy now, pay later). As an expanding urban middle class and working class financed their rising standards of living partly through increased borrowing, household debt rose faster than income. By 1929, about 60% of cars and 75% of all radios were bought on credit. (A top-of-the-line radio cost as much as the average cost of a car!) Total consumer debt doubled in just four years, going from $1.4 billion in 1925 to $3.0 billion in 1929. Hundreds of new banks and finance companies were started to provide consumer credit.
Home ownership financed by new forms of mortgage debt rose rapidly. Mortgage debt rose over eight times from 1920 to 1929. Hundreds of new “saving” banks were started to supply mortgages.
Household balance sheets were leveraged with consumer debt and mortgages backed by illiquid assets as collateral that quickly lost market value starting in the fall of 1929. Even as savings were being wiped out, families still had to make installment and mortgage payments.
By October 1929, the economy was already in recession. Railroad car loadings and steel production had been falling since summer. The Fed’s Index of Industrial Production was also declining. Auto inventories were rising. But a general recession wasn’t recognized and declared until late in 1929. These numbers had little influence on analysts or investors.
1930
The recession was sudden and severe. Industrial production fell about 5% in October and another 5% in November. The contraction continued into 1930; industrial production fell another 30%. Unemployment doubled, from about 1.5 million (3% of the workforce) in the summer of 1929 to about 3 million (6%) in the spring of 1930, and then rose to about 5 million (10%) at the end of 1930. At least 25% of American families – a higher percent of non-farm families – were hit by unemployment sometime before the end of 1930. About half of the Great Depression’s total decrease in industrial production and about half of the increase in unemployment had already occurred by late 1930. Families experiencing unemployment couldn’t meet loan payments. (Most urban families were one-income families. Also, there wasn’t unemployment benefits like today.)
In 1930, farmers were hit with lower prices, the Dust Bowl (huge dust clouds), loss of deposits in local failed banks, and inability to make loan payments on equipment. Farmers started to lose their farms; banks foreclosed on about 100,000 farms in 1930. (See the movie and/or read the book about this – The Grapes of Wrath.) The Dust Bowl continued until 1940, helping to wipe out many more farmers (see PBS video on the Dust Bowl; the dust clouds are unbelievable).
Demand for consumer durables was especially hard hit. Car sales were 5.4 million in 1929, falling about one-third to 3.4 million in 1930. (At the bottom of the depression, auto production would fall by 90%.) Sales went from $3.5 billion in 1929 to $0.8 billion in 1932. Repossessed and used cars glutted the market. (Good for my grandfather; he bought a used truck in the 1930s for $30 to start a small business. The seller had to teach him how to drive.)
AFTER 1930 – A QUICK SUMMARYAs the Great Depression got worse, stock prices kept going down, about 5,000 more banks went under wiping out depositors, unemployment rose to catastrophic heights, families couldn’t meet loan payments and lost their houses and cars.Eventually, almost half of all mortgages were in default.When the worse was over, real GDP fell by about 25% and nominal GDP went from about $100 billion in 1929 to about $50 billion in 1932. In 1929, corporations made total profits of about $10 billion; in 1932, they lost about $3 billion. Business investment disappeared.The depression and consequent disappearance of corporate profits (earnings) had consequences for stock prices. Using valuation metrics like price/earnings (P/E) ratios, there was no support level, no bottom, for stock prices. The other support for stock prices – dividends – also fell drastically as profits disappeared. Trading volume fell, from an average around 10 million shares per day in October 1929 to around a half a million shares per day in 1932.By 1932, market indexes had fallen 80-90% from October 1929.The negative reinforcing feedback effects between the real economy and the financial sector created the Great Depression. Again, the size of the total economy was about $100 billion in 1929. Between 1929 and 1932, stocks (and stockholders) lost about $30-$40 billion in value. Total bank credit fell $20 billion.
WAGES AND PRICES
Wages and prices acted differently at the beginning of the Great Depression compared to earlier recessions. The Consumer Price Index (CPI) went down only 2.6% in 1930. Nominal (current dollar or money) wages in the large industrial corporations, and other large companies, stayed virtually constant in 1930. Industrial prices also did not decline. Instead, large manufacturing firms laid off employees and cut production, watching sales and profits plummet. Investment stopped, hurting the capital goods sector. The question all this raises is: Why didn’t large companies quickly cut wage and prices, as in prior recessions?In a series of conferences in November and December 1929, President Herbert Hoover urged the leaders of the largest companies not to cut wages. Many corporate presidents agreed, including the presidents of General Motors, Ford, General Electric, Westinghouse, Standard Oil, U.S. Steel, Du Pont, Firestone, and Goodrich. The idea was that by not cutting the wages, and therefore income, of their workers, they were helping to limit the fall in overall (aggregate) demand. Keeping wages and thus prices high probably contributed to the large decreases in demand for consumer durables. As demand and output fell, these companies laid off workers, contributing to the rapid increase in unemployment. It was only in late 1930 and 1931 that large companies began cutting wages.In 1933, President Franklin Roosevelt had Congress pass the National Recovery Act (NRA), an economy-wide, mandatory version of President Hoover’s voluntary program.
FINANCING ECONOMIC GROWTH AND DEVELOPMENT IN THE 1920SThe financial sector as a whole was a growing part of the economy in the 1920s. Finance doubled as a share of GDP with most of the growth coming in the second half.The raising of large amounts of financial capital fueled the economic expansion, not just on the supply side but also on the demand side.An expanding urban middle class financed its rising standard of living partly through increased borrowing; household debt rose faster than income. In addition, mortgage debt rose rapidly. Household balance sheets were leveraged with debt backed by illiquid assets that quickly lost market value starting in the fall of 1929.The purchase of consumer durables such as autos, radios (some cost as much as cars), furniture, and some electrical appliances was usually financed with debt, often with money borrowed at the new consumer finance companies. Miss one payment and the product was repossessed. One of the largest banks that specialized in car loans, controlled by Henry Ford’s son Edsel, went under.
THE AMERICAN BANKING SYSTEM AND THE FED
At the beginning of 1929, the United States had 25,000 banks. Most, about two-thirds, were outside the Federal Reserve System (the Fed). States and the federal government had passed laws to protect local banks from competition from larger banks by limiting the geographical reach of banks. The small rural banks depended on the health of the local farm economy. It should have been an alarm bell as thousands went under in the decade before the crash.Between 1929 and 1933, the U.S. banking system – unregulated, fragmented, without deposit insurance – went through waves of bankruptcies as farmers, businesses, and consumers defaulted. In the two years 1929 and 1930, about 10% in of the total number of banks failed. About a third of all banks would disappear during the Great Depression. Depositors lost their savings. Farmers and processors could not repay loans and small, local banks went under. Solvent farmers could not get credit to produce. Urban and suburban banks started to go bankrupt as consumers, local businesses, and homeowners defaulted on loans. At the depth of the depression, half of all mortgages were in default.
Why did not the Fed save the banking system from collapse? One of the Fed’s powers was to be the “lender of last resort” to member banks. Banks in a liquidity squeeze could borrow at the rediscount window at the Fed banks. This was limited since one-third of banks were members of the Federal Reserve System. But they were the larger banks; smaller banks typically held part of their reserves at larger banks. As the economic crisis deepened, small, local banks began asking for their deposits at the larger banks. This reduced reserves at the larger banks which were not balanced by new liquidity from the Fed.
Through all this, the eleven regional Fed banks outside of New York and the governing board in Washington did virtually nothing. Controlled by local bankers and manufacturers, they did not believe it was their responsibility to save the banking system. Their governing boards limited the types of collateral they were willing to accept from borrowing banks at the discount window. They did not actively encourage local banks to apply for funds. The exception was the sixth regional located in Atlanta. They faced the first regional banking crisis and successfully contained it.
This attitude of letting the economy and its banks to go to hell was shared by Andrew Mellon, Hoover’s Secretary of the Treasury, who believed a major recession was good for the health of the economy. (He was too busy adding to his fabulous art collection by secretly and illegally buying art from the Soviet Union, which needed hard currency to finance its spying operations. These paintings, taken from the Hermitage, are now in the National Gallery collection in Washington. The spies later stole America’s atomic bomb secrets.)
By the spring of 1933, the American banking system was near total collapse. Over half the states had declared a “bank holiday,” closing all the banks in their states to see which ones could be saved. This meant that depositors could not withdraw their savings. The new Roosevelt Administration’s first act in March 1933 was to declare a national bank holiday. Roosevelt’s second act was to take the United States off the gold standard.
INTERNATIONAL ASPECTSIn the 1920s, New York had become the center of the global financial system. This was a consequence of World War I and its aftermath. During the war, England and France partly financed their war effort with substantial borrowing from New York banks. England and France could not borrow from the American government because Wilson was afraid isolationists could help defeat him for reelection in 1916. During the 1920s, Germany borrowed large sums from New York banks to restart its economy and pay war reparations to England and France.Central bankers and large investment banks spent the 1920s trying to rebuild the global financial system shattered by World War I. They saw the pre-war gold standard as a control mechanism to overcome the economic dislocation and instability caused by the war. The key, as they saw it, was to fix the value of national currencies in gold and thus, to each other. By 1929, almost all currencies, including the dollar, were on the gold standard. (In a bit of bad timing, Japan went on the gold standard in January 1930.)The gold standard depended critically on the pound sterling and London before the war, and the dollar and New York after the war. The New York Fed chairman (Benjamin Strong) worked closely with the chairman of the Bank of England (Montagu Norman) and other central bankers to coordinate policy, primarily changes in interest rates to influence currency and gold flows. Central banks and investment banks, mostly American, would also loan money to foreign governments to ease pressure on their currency. But America’s commitment to reforming the global financial system was limited. There were three major problems:1) Entente (Allies) war debts and German reparations. The Entente countries, including England and France, had borrowed over $10 billion in America to help finance the war. After the war, the Allies imposed reparations on Germany, payable mostly to England and France. These two countries relied on payments from Germany to meet the interest and principal payments on their debt to the United States. But the German economy had a hard time recovering from the war and taxing its people to raise reparation funds. Instead, Germany depended on borrowing from private banks in New York. Some of the funds would then go to London and Paris, to be cycled back to New York. Towards the end of the 1920s, more of the loans were short-term (“hot money”) rather than the usual long-term credits. The system functioned as long as American bankers were willing to lend to Germany, that is, to roll over rather than call short-term loans.
2) England went back on the gold standard in 1925 at the pre-war parity. It overvalued the pound compared to other currencies. English exports were priced out of global markets; imports were relatively cheap. As a consequence, the English economy had a hard time recovering from the war, experiencing deflationary stagnation. England ran a trade surplus before the war but a trade deficit after the war. Defending sterling’s price in gold meant high interest rates to attract foreign funds, low economic growth, deflation (with pressure on wages), and high unemployment rates.
The New York Fed often changed American interest rates to accommodate the Bank of England’s attempts to deal with England’s economic and financial problems.
3) Central bankers would change interest rates to influence cross-country capital and gold movements. But changes in interest rates also affected domestic economies. Interest rates in New York were actually lowered at the beginning of the stock market boom to encourage money flows to England. But lowered rates also reduced the cost of call money and brokers’ loans to speculators, fueling the stock market bubble.Gold was also “high-powered” money, a part of the banking system’s reserves. An influx of gold allowed a country’s banking system to created money by creating new loans. Throughout the 1920s there was a net inflow of gold into the United States. American banks could increase the amount of loans to American consumers, stock market speculators, farmers, and corporations.
Just when it seemed the global financial system was stabilizing, it started to unwind. Germany went into recession in 1928. The head of Germany’s central bank threatened to stop paying reparations. Money flowed out of Germany. American bankers stopped expanding short-term loans to Germany. The American government refused to reduce Allied war debts; England and France could not reduce debt payments to private American banks. By 1929, Germany had reduced paying war reparations and the crucial cycle of American loans to Germany, German reparation payments to England and France, and their war debt payments to American banks began to unravel. American banks were now sitting on billions of dollars of bad loans. A delegation of American bankers went to Europe to renegotiate the repayment timetable of German reparations. A slowdown in economic growth in the industrialized countries led to a large decrease in global commodity prices (inelastic demand). Countries that depended on commodity exports went into recession and were the first countries to leave the gold standard.
The U.S. economy went into recession and the stock market crashed. One consequence was that American banks started calling in German loans, deepening the German recession. There was a large and sudden increase in German unemployment. This contributed to the rise of Hitler and the Nazi Party, which received only 2.6% of the vote in 1928 but over 35% in 1930. The Nazi Party was the largest right-wing party, making it almost inevitable that Hitler would become Chancellor as conservatives tried to form an effective government to counter rising left-wing support. In office in January 1933, Hitler quickly renounced all reparations payments.
By 1931, the English government realized that England would not get out of long-term stagnation without eliminating the deflationary effects of the gold standard. England and 20 trading partners left the gold standard. The English pound sterling depreciated (went down in value) against the dollar, making America’s recovery more difficult.
THE GOLD STANDARD AND DOMESTIC POLICY
The Hoover Administration’s and the Fed’s commitment to the gold standard limited domestic policy options. Budget deficits, lower interest rates, or increasing the money supply through Fed lending to banks would have tempted foreign central banks and depositors to withdraw gold. This was one reason the Fed did not use gold as part of the monetary base to expand credit through its discount window. Another reason: the Fed might lose gold and contracted credit would also happen if Americans used dollars to buy gold. This was legal until President Roosevelt took America off the gold standard in early 1933.
The worsening recession and the gold standard led to deflation. Deflation led to the higher real cost of debt to borrowers, and then defaults as incomes and asset prices fell. The banking system weakened. Banks failures rose dramatically in 1931 and 1932. Seeing the deep recession and the weak financial sector, foreigners began pulling gold out in 1932. The Fed raised interest rates to keep the gold in the U.S. The Hoover Administration raised taxes to reduce deficits and signal “fiscal responsibility.” Again, by early 1933, the entire U.S. banking system was approaching total collapse.
THE SMOOT-HAWLEY ACT OF 1930
At the beginning of the Great Depression, Congress passed the Smoot-Hawley tariff bill of 1930 to protect farmers. Of course, everyone in Congress added their favorite worthy group of constituents who wanted protection. Tariffs went up to 60%. 1,000 economists, a rather conservative bunch in 1930, warned of the negative consequences of the bill.
The main target was Canada, America’s largest trading partner. The more anti-American party won the next Canadian election.
Anti-American boycotts of American products started in Europe. American exports to Europe and Japan fell.
England walled off its Dominion countries and colonies from American imports; France and Holland did the same with their colonies. Since imports and exports were a small percent of the American economy, about 5% in total, the Smoot-Hawley tariff bill was probably not a major cause of the Great Depression. Both imports and exports fell by about $1 billion, so the Act had little net macroeconomic effect. But, on the margin, it probably contributed somewhat to the length and depth of the Great Depression.
Tariffs and other barriers to trade reenforced America’s isolationism. To keep America out of the looming European war (on England’s and France’s side), a strong America First movement arose. Some of its members, including Charles Lindbergh and a future president of Yale, were pro-Hitler. The organization effectively disbanded in December, 1941.
A LONGER VIEW OF THE STOCK MARKET CRASH OF 1929
By the end of 1929, the Dow Jones Index was back to the beginning of 1928. It was only 17% lower than the beginning of 1929 – a year of above-average gains followed by larger losses. So any investor who bought stock for cash at the beginning of 1928 or earlier, was about even. Anyone bought stock at the beginning of 1929 was even by the end of the first quarter of 1930, before the market turned down again. Only speculators who bought stock on margin were wiped out. This included many large speculators. Of course, anyone who held their stock until the end of 1932 lost almost of the value anyway. And anyone who bought on “dips” between 1929 and 1932 lost money.
It is likely that many families who still had stock after 1929 were later forced to sell because of some combination of unemployment, lose of savings in a collapsed bank, and to meet installments on borrowings for consumption and maybe a mortgage on their home.
Anyone who bought at the top in September 1929 and held onto their shares had to wait until 1954 to break even.
Since 2000, there has been three market contractions of similar magnitude to October 1929. The last two could have led to a prolong depression. But they didn’t. The difference is that the federal government stepped in with massive fiscal stimulus and support for failing companies.
SUMMARYIt is a mistake to see the stock market as separate from the rest of the economy. It was part of the financial sector, which greatly expanded in the 1920s and became a more important part of the economy. The financial sector helped finance the economic growth and new products of the 1920s, especially demand for the new consumer durables. Gains from the stock market helped to finance the flamboyant life-style of a small percentage of consumers, symbolized when wealthy Americans on luxury trans-Atlantic steamers could radio their brokers in New York with stock orders. The boom in buying consumer durables and housing was made possible by the expansion of consumer loans and home mortgages. Increases in consumption and consumer loans were tied together. In contrast, small local banks were tied to the stagnant, leveraged agricultural sector. Although the bottom of the Great Depression came over three years after the start, over half the fall in output and real income occurred in the first year, by the end of 1930. This was a large and rapid decline. The stock market crash was a catalyst; it accelerated the decline in income, wealth and the demand for goods and services through feedback effects between the financial sector and the real economy.The stock market crash of 1929 was not the only reason for the depression. Many of the systemic risks were due to global and domestic problems caused by the First World War and its aftermath. There were continuous feedback effects between the real sector and the financial sector. What changed was the size and importance of the American financial sector – as an international lender, as a raiser of capital, as a provider of household credit, as a seller of financial instruments.
The continuous feedback effects also help explain why the depression lasted so long and was so deep. Waves of bank failures, loss of savings and assets, lack of the Fed’s responsibility as “lender of last resort” all contributed to lengthening the depression and making the recovery difficult
Many of the government recovery programs of the Hoover Administration and the early Roosevelt Administration were substitutes for a financial sector that had ceased to function.
The American economy in the 1920s became not only larger but also more complex. There were more “fault lines.” Recent studies of “complex adaptive systems” indicate they can go from seemingly stable to unstable very quickly. New potential fault lines were added in the 1920s – stock market speculation, agricultural stagnation and debt, consumer durables bought with loans, and America’s involvement in international finance.
The structure (including rules and lack of rules) of the financial sector when the crisis hit was important. The banking structure and much of the rest of the financial markets had not adjusted to the economic changes of the 1920s. Fragmented domestic banking, the gold standard, lack of information and analysis, absence of oversight, and widespread manipulation and fraud all contributed to a financial sector that was ill-prepared to handle the stresses beginning in 1929. Changing the rules – increasing the confidence of depositors, borrowers and investors – was an important part of the New Deal.The depression was made worse by the antiquated mentalities of those in power. They were faced with the instabilities and dislocations of an international financial system radically changed by World War I. Their response was to revert back to the rigidity and deflationary pressure of the gold standard. American officials and the three Republican presidents in the 1920srefused to decrease Allied war debt, a necessary condition to stabilize the international financial system. In America, an increasingly industrialized, mass consumption economy fueled by financial capital and consumer debt depended on a fragmented banking system of small, local banks designed for a decentralized agrarian economy. Fed and government officials strongly believed in market competition and laissez-faire, which was ill-suited to an economy dominated by large, mass production corporations and a greatly expanded financial sector.
CONCLUSION
The real economy was growing rapidly, probably around 6% in 1929. This growth rate was unsustainable. Part of it was because of pent-up demand for autos; many consumers had waited for Ford to get back to full production. There was a big increase in the purchase of autos and other consumer durables during this period. A high percent of consumer durables were bought on credit.Rising domestic optimism was behind the big increases in both output and the stock market. Employment levels were high. This optimism is hard to quantify but it was pervasive outside of some rural districts. (See video)Recessions start with an unexpected shock. They are often outside of economic models used at the time of the shock. In 1929, the stock market decline was mostly independent of the real economy recession. In 1930, stock market recovered 40% in first quarter, indicating investors believed the decline was a “correction” and stock prices were cheap. But the real economy continued its rapid deterioration. When recognized, investors realized their optimism was misplaced and the stock market turned down again. The recession of 1930 does not show up in financial figures except for the stock market and more than the usual number of small banks failing. As the buying of consumer durables and other mass-produced consumer products declined, profits fell. Investment in manufacturing declined, as the reason for increasing capacity disappeared. The government did not make up any of the loss of income in 1930 through welfare programs or fiscal deficits. (Even during the 1930s, Roosevelt’s budget deficits were much smaller than the decline in private incomes and corporate investment. A misguided policy to balance the budget in 1937 led to a severe recession that wiped much of the output and employment gains of the prior four years.)The structure of the economy had fundamentally changed since the last depression that occurred in the 1890s. New economic and financial fault lines appeared in both rural and industrial America. The situation was made more dangerous as the global economy struggled to recover from World War I and its chaotic aftermath. Only the New York Fed and large New York banks worried about international instability and its possible consequences. Eventualy, all Americans would become aware of the consequences of post-WWI overseas problems, the stock market crash of 1929, and the beginning of the Great Depression in 1930. On December 7, 1941.
======================================================The best introduction to the 1920s and the stock market crash is Frederick Lewis Allen, Only Yesterday; An Informal History of the 1920’s. This is a wonderful popular history of the 1920s and the crash. It shows how the economic, social, and psychological changes in the 1920s contributed to the speculative frenzy in the stock market. Allen lived through it all. You can skip some of the chapters the first time through; for example, skip Chapters III, VI, IX, And X.If all of this seems complicated and confusing (it is), you might want to see a summary:
China’s dominance of the interconnected group of high-tech products will make China the dominant manufacturing country in the world. China will also dominate the global economy, exporting its high-growth products at falling prices and developing joint production in many countries.
This includes renewable energy. China is the world’s largest and lowest-cost producer of most renewable energy technology, especially solar panels and batteries. China is also developing and installing many new technology nuclear reactors.
Combined with China’s surge in exports to the world outside of the United States, as a reaction to American tariffs and bans on Chinese exports, most of the world’s advanced technology will be based on Chinese technology.
China will have to deal with internal, domestic problems. The long-term problem will be the large decline in population, especially the shrinking of the working age cohort. this is one reason that China is concentrating on the development and deployment of industrial robots and AI applications.
INTRODUCTION
According to the World Bank, China’s Gross Domestic Product (GDP) was $18.7 trillion in 2024, compared to $29.2 trillion for the United States. China’s economy was 64% the size of the American economy; a generation ago, in 2000, China’s GDP was only 12% of America’s.
China has been a spectacular economic success story. China has increased its share of global manufacturing from 6% in 2000 to 32% in 2024. Manufacturing makes up 28 percent of China’s economy, compared with 11 percent in the United States.
China sees it dominance of interrelated advanced technologies as key to its geopolitical global dominance of the United States.
THE BEGINNING OF CHINA’S ECONOMIC RISE
After the death of Mao in 1976, a more pragmatic group of Communist leaders seized power and began to change China. Their model was Singapore, whose population was mostly Chinese. Singapore’s economic growth model was that the dominant political party would direct economic growth. It invested in infrastructure, including condos for most of its population. It directed investment. It invited foreign companies to invest in the country. It became part of the global economy.
China did much of the same but since it is much larger, it had to go further. It liberalized agriculture, going from huge communes to allowing individual farmers to rent land. That doubled food production. Then it concentrated on manufacturing, with subsidies and favorable tax laws. They established Special Economic Zones for foreign companies (little Singapores). Foreign companies were welcomed but they had to partner with a Chinese company, which accelerated China’s absorption of foreign technology and management techniques. By combining low labor costs and modern infrastructure with the production and assembly technology of foreign corporations, China became the world’s largest industrial producer and exporter. But, unlike Japan at the same stage in the 1980s, China went further. The Chinese government’s strategic plan was to make Chinese companies the leading developers, innovators and producers of “cutting-edge” products. This included becoming the world’s largest producer of solar panels, lithium-ion batteries, wind turbines, automated factories, robotics, rare earth minerals, drones, robotaxis, and electric vehicles (EVs).
SUMMARY OF CHINA’S CURRENT ECONOMY
China mines about 90 percent of the world’s rare earth minerals and it does the chemical processing for over 90 percent of the world’s total. The country also makes more than 80 percent of the world’s batteries, more than 70 percent of its electric cars, and about half of the world’s steel, iron and aluminum, according to data from the International Energy Commission.
China has the second largest economy in the world. According to official statistics, it has the fastest growth rate of any industrialized country. But economic growth has slowed down, from highs of 10% per year to the current reported growth rate of 5%. Probably closer to 3% – see
CHINA’S ECONOMIC STATISTICS
Because of China’s immense population, 1.4 billion people, per capita income is in the “middle-income” range. China is still a low-consumption country; consumption expenditures as a percent of total output is a little more than half that of the United States, about 40% compared to about 70% in the United States. Chinese have a very high savings rate, partly because of small social welfare and retirement programs.This creates and frees up a huge amount of investment capital for expanding production and exports.
China’s spending on research and development increased from $70 billion (in constant dollars) in 2000 to $470 billion in 2023 (Economist estimate). State-controlled banks have lent $1.9 trillion over the last four years to build new factories and upgrade existing factories with robots and automation. This is probably an attempt to deal with the beginning of a decline in the size of its work force and a substitute for the decline in housing construction.
China’s BYD (BYDDY) sells more electric vehicles in the world than any other company, including Tesla. Although banned in the United States, BYD’s global sales continue to rise quickly while Tesla’s global sales are falling. In early 2025, BYD’s sales in Europe passed Tesla’s sales.
Chinese companies, plus foreign companies in China like VW, produce more EVs than the total auto production in the U.S., Mexico and Canada combined.China is the world’s largest market for EVs; over half of the cars sold in China are electric vehicles (EVs) compared to 20% in Europe and about 10% in the United States. In 2024, EV sales in China were about nine times greater than in the United States.
In 2023, 2024, and 2025, China installed more industrial robots than the rest of the world combined.
China produces, installs and exports most of the world’s solar panels, about 80%. To avoid high U.S. tariffs, many are assembled or trans-shipped through other Asian countries. Biden and Trump have placed high tariffs on solar panels shipped from China and these countries. Combined with new American domestic policies unfavorable to solar energy, these policies will probably slow down installation of solar panels in the U.S., unless reversed at a later time.
China has surprised the world with its rapid advances in developing AI models, including DeepSeek. New Deep Seek models might rival ChatGPT’s most advanced models.
Huawei, a giant Chinese telecomm company, accelerated its development of semiconductor chips after the company’s chips and telecomm equipment were banned in the U.S. The CEO of Nvidia, exports of whose high-end chips to China were banned until recently by U.S. policies, has stated the ban has been a failed policy, only accelerating development of similar chips by Huawei and other Chinese companies. The ban has been partially lifted.
China’s AI models are open-source (free) and are used by a number of American and European companies.
CHINA’S ECONOMY
China’s economic strength is based on turning inventions into innovations, the mass production of commercial products. This has been achieved through a combination of massive government support of research and development, followed by subsidies to private corporations to produce and improve the new technology.
China has a manufacturing sector that is larger than those of the United States, Germany, Japan, South Korea, and Britain combined. It produces some of the world’s most advanced technology in the interrelated “cutting edge” industries.
China builds industrial capacity anticipating high future growth rates. As a consequence, there is excess capacity in many industries, including EVs and solar panels. Also in construction industries like steel and cement. China produces more steel than the rest of the world combined; the industry is currently in a recession because of less housing construction. Construction in housing is being replaced by new construction of factories with new machinery and robots, and construction of overseas infrastructure projects under the Belt and Road program.
China is installing more renewable energy technology than any other country; the increase in the amount of electricity produced by solar in 2024 was greater than the total amount ever produced in the United States. But China is also the world’s largest producer of coal. Chinese cities have some of the worse air quality in the world; China’s interim strategy is to shut down old factories near cities, especially Beijing.
Coal production is not going down because of expanding demand for energy. China needs both, especially with large internal investments in new data centers. But by 2030, China hopes to start reducing coal production and replacing coal with renewable energy technologies.
China also relies on imported oil and natural gas, especially from Russia and Iran. The country buys oil at a discount from world prices.
China is the world’s largest producer, and consumer, of cars. China is rapidly replacing gasoline-powered cars and other vehicles with EVs. China’s strategy is to replace imported oil for gas-powered cars with domestically produced EVs built with Chinese batteries and in the long run, have electricity for EVs generated by domestic renewable sources.
China is rapidly expanding its EV robotaxi fleet. China is also starting to increase exports of EVs everywhere except in the United States, where Chinese EVs are effectively banned. China will probably become the dominant seller of EVs in most of the rest of the world.
China’s economic development has been spectacular but growth is slowing down. The development strategy in the past was massive construction, both public and private, joint ventures with foreign companies, exports, and limiting domestic consumption. Internal construction relying on housing is less important because of the huge amount of housing already in place that is either unsold or empty.
There will be little if any growth in housing construction in the future because of low family formation due to a very low birth rates and the large inventory of unsold apartments. (See the section below – China’s Housing Crisis – for details.)
China’s economy can continue to grow because of high levels of investment, overcapacity in new technology, and a large number of unemployed young people and college grads with technical degrees. The current strategy is to invest heavily in innovative new technologies such as advanced computer chips, AI, robotics, automated factories, new drugs, EVs, batteries, hydrogen energy, nuclear power, and solar panels. Investment in these industries will come mostly from domestic sources.
In addition to being the world’s largest producer of solar panels and wind turbines, China is investing heavily in “green” hydrogen as a renewable resource. This is produced using electrolysers to split water molecules into hydrogen and oxygen. China already produces about 40% of the of the world’s electrolysers. The country is building pipelines from production centers to industrial centers such as Shenzhen, which already has a fleet of buses powered by hydrogen.
China is catching up in areas of chip production. The country has rapidly improved its chip technology; it can now produce all but the most advanced chips in the world. U.S. bans on selling advanced chips to China is less effective than it would have been in the past. There is in addition a thriving global black market in Nvidia’s advanced chips.
China has employed its advanced chips to develop AI models such as DeepSeek, which are already almost as good as the most advanced American AI models.
The Chinese government has just approved a new $137 billion venture capital fund to accelerate development of robotics and AI.
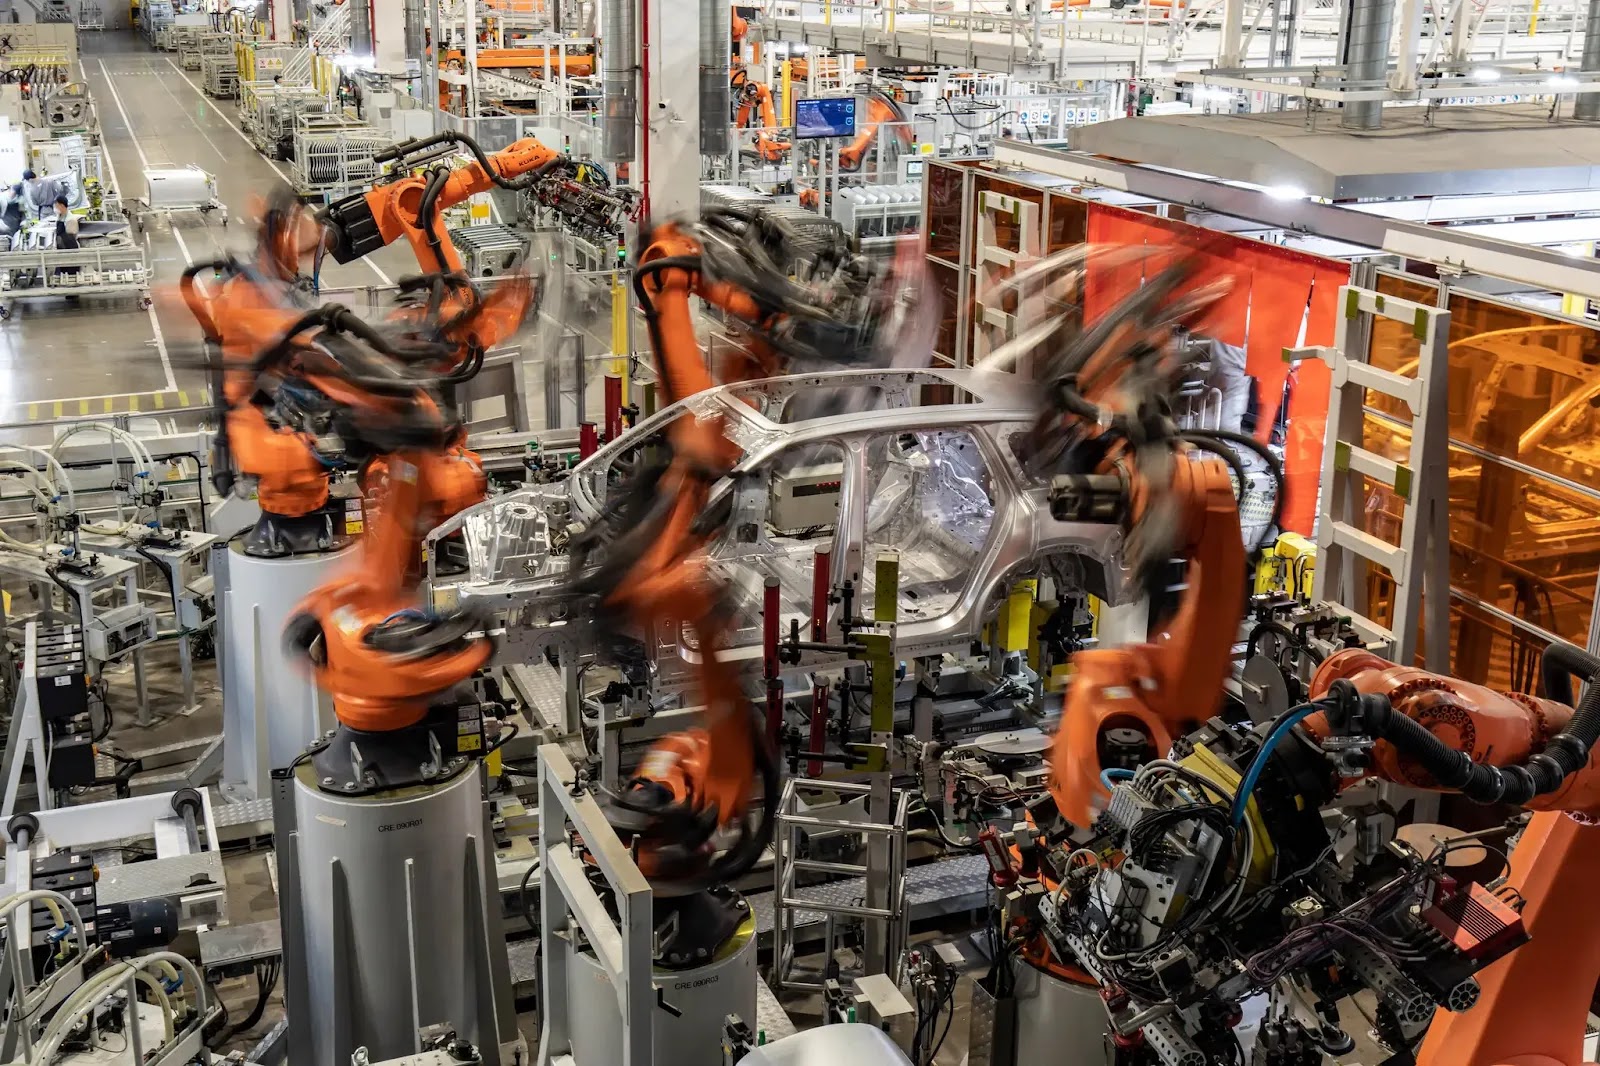
China already has some of the most automated plants in the world, especially in electric vehicle production.
RARE EARTH METALS AND ELECTRIC MAGNETS
China controls the entire supply chain of rare earth metals, from mining to processing to producing electric magnets. China produces over 90% of the rare earth minerals and almost all of the processing equipment and processing.
Electric magnets are inputs into producing a wide range of modern weapons and automobiles, both gas-combustion and electric. A single gasoline-powered car can have more than 40 different rare earth magnets inside electric motors that power the brakes, seats, steering, power windows and other systems. Electric cars have even more rare earth magnets.
Thousands of companies world-wide use Chinese rare earth magnets. China has announced widespread export controls on the magnets and products that use the magnets. This seems to be an attempt to pressure Europe to relax tariffs on imported Chinese electric vehicles, at a time when Europe wants to step up armaments production to aid Ukraine.
China produces more than 200,000 tons of rare earth magnets a year. Most are used domestically. Much of the production is sold to CATL and BYD, the world’s largest producers of batteries. BYD is the world’s largest producer of electric vehicles (EV). About 40,000 tons are exported to the United States and Europe. The only other large producer is Japan, which makes about 40,000 tons of magnets a year, most for car companies in Japan and South Korea. The United States and the rest of the world are trying to increase production but the current total is negligible. Production is difficult because of tight quality control and a long learning curve for employees.
China’s domination of the entire supply chain from rare earth minerals mining to final products like EVs and drones is the result of decades of investment in research and development. A majority of undergraduates in China major in math, science, engineering or agriculture, according to the Education Ministry. And three-quarters of China’s doctoral students do so. By comparison, only a fifth of American undergraduates and half of doctoral students are in these categories. Over half of the graduate students are foreign.
China has close to 50 graduate programs that focus on either battery chemistry or the closely related subject of battery metallurgy. Only a handful of professors in the United States are working on batteries.
Much of the research and development is done at Central South University in Changsha, a city in south-central China. Central South University has nearly 60,000 undergraduate and graduate students with extensive, modern labs.
Chinese companies have been buying up mineral producers in other countries. China’s largest battery producer, CATL, which produces 40% of the global production of batteries, wants to produce in the United States for the American market. Building and equipping an electric-car battery factory in the United States costs six times as much as in China, said Robin Zeng, the chairman and founder of CATL. The work is also slow — “three times longer,” he said in an interview.
This is mostly a summary of an excellent series of articles by Keith Bradsher of the New York Times.
Update (11/25). In a recent trade agreement with the U.S., China has promised to remove its embargo of rare earth minerals and electric magnets for one year. This will probably slow down America’s drive to find and develop alternative sources of supply. In exchange, China has agreed to buy an undisclosed amount of American soybeans.
DRONES
China is the world’s largest producer of drones. DJI, based on Shenzhen, produces about 70% of all commercial drones sold in the world. They are used for hobby and industrial applications, including aerial photography, package delivery, and weather research. Versions of the DJI drones cost between $300 and $5,000.
China produces millions of drones a year. The U.S produces about 100,000 drones a year.
Drones have become an important weapon in the war in Ukraine. Ukrainian forces beat back the Russian invasion by innovating deadly modifications to drones bought from DJI. Russians cannot use tanks to support infantry because of the threat from Ukrainian drones. Russian drones are used in indiscriminate bombing of Ukrainian cities. Drones and other AI-controlled weapons are rapidly changing warfare.
When U.S. drone manufacturer Skydio was sanctioned by Beijing in October 2024 over arms sales to Taiwan, that quickly cut off the company’s supply of batteries, according to the Financial Times. China produces more drones in one week than Skydio produces in a year.
American drones that carry Predator and Reaper missiles cost between $3 million and $5 million.
A few months ago, the U.S. army carried out a four-day exercise testing drones produced by U.S. startups. They were failures. The only one that partly performed was a drone an American company bought from Ukraine and modified.
CHINA’S AUTOMOBILE INDUSTRY AND GLOBAL DOMINATION OF THE ELECTRIC VEHICLE (EV) MARKET
China today has enough capacity to manufacture half of the world’s 80 million cars in annual sales, or 40 million vehicles. Current production is about 28 million and rising. (Total U.S. production is around 9 million, although American car companies assemble cars in Canada and Mexico.) Over half of Chinese production is now EVs. China’s electric vehicle companies continue to build new capacity. By 2030, China’s capacity could climb to 75% of the world’s volume, most of it to produce EVs.
The total production capacity figure above is misleading. There is massive over-capacity of gas-powered car manufacturing. Production of gas-powered cars has fallen by over 10 million units since reaching a peak of 28 million in 2017 with little reduction in production capacity. Thus, China’s EV industry can double sales just by replacing gas-powered cars.
American car companies in China, producing mostly gas-powered cars, have falling sales and are losing money. In the past, General Motors and VW were the largest car producers in China. Now they are not even in the top 20 because of Chinese EV sales. General Motors just took a $5 billion write-off of their investment in China. Michael Dunne, an observer of the Chinese auto industry, believes that the position of foreign auto producers can only get worse and some, including General Motors, will eventually leave China.
Hyundai has closed a modern production plant in China; many foreign plants are operating far below capacity. Ford has announced they have lost money over the last five years from their Chinese operations.
When Volkswagen opened a huge electric car assembly plant last year in Hefei, China, it ordered just one robot imported from Germany (for display). The company bought the other 1,074 robotsfrom a factory in Shanghai. VW intends to source all of its parts in China.
Volkswagen has also moved its R&D from Germany to China, hiring 3,000 Chinese engineers. The China factory will be the source of VW EVs sold in Europe. At the same time, VW announced a massive cost-cutting program in Germany and the rest of Europe.
Total EV production in 2024 was 12.4 million cars, close to half of all car production. Forecasts for 2025 are uncertain because of major reductions in government incentives and subsidies after September 30 of 2025.
To increase production of electric autos quickly, China is stepping up exports. Exports of all EV exports in 2024 was around 1.25 million. EV exports may be around 2 million in 2025.
Besides autos with Chinese nameplates, foreign automakers are using China as the manufacturing base for exports under their own names. Foreign companies originally build large plants in China with Chinese joint venture companies to produce gas-powered cars for the Chinese market; at least one has been closed (Hyundai) and others are operating at a low percent of capacity. They are forced to stay open by local authorities, who are afraid of local unemployment.
Tesla shipped 344,000 China-built EVs to Canada, Europe and other markets in 2023. Volkswagen, Renault and BMW export made-in-China EVs to Europe. GM’s best-selling Chevrolets in Mexico are produced in China. Hyundai and Kia expect to sell 200,000 cars made in China back to South Korea and into global markets. Ford is exporting about 100,000 trucks and SUVs to Asia, Africa and the Middle East.
BYD, China’s largest EV producer, will produce more EVs than Tesla globally this year. Tesla sales on falling in China. In Europe, Chinese nameplate EVs are gaining market share as Tesla sales fall. For leading companies like BYD, export sales are increasingly important.
Chinese EV buyers are younger than those in the U.S. and Europe. They are more interested in a car’s software and entertainment systems.
Chinese EVs companies are teaming up with China’s large electronics corporations to install “wizzy” electronics and “infotainment” systems in their vehicles. Some see EVs as “smartphones on wheels.” This has created an opportunity for China’s huge tech firms. Huawei, Chinese huge producer of smart phones and other electronics, has teamed up with Chery to become a major EV producer. Xiaomi, sometimes called “China’s Apple,” produces popular high-end cars that compete with Porsche’s Taycan SUV but sells at half the price.
Baidu is a leader in the development of autonomous-driving software for robotaxis. China is testing robotaxis in 50 cities and has more robotaxis than any other country.
With improving engineering and attractive operations, some Chinese EV companies are trying to compete at the top end of the market. These companies intend to compete with top-end cars in the global market.
There is massive overcapacity in gas-powered car production and probably overcapacity in the EV sector. About 100 companies are producing EVs, many of which started production in the last few years.
Collectively, EV companies offer a wide range of models and options. Because of the industrial overcapacity and economies of scale in production, a price war to gain market share has broken out. EV prices start at around $23,000; BYD says they are coming out with an even cheaper model. Profits of the industry leaders are falling. The industry as a whole is probably losing money.
With lower government tax exemption and other subsidies, EV companies are planning on reducing wholesale prices to dealers in 2026. Growth will probably be lower than in the past few years and total financial losses will probably be greater.
China dominates the global supply chain to produce EVs, from mining to mineral processing of rare earth mineral to the production of electric magnets to the production of battery cells.
For reasons discussed below in the sections on demographics and housing, China’s EV industry may not grow, or grow slowly, after it replaces domestic gas-powered car production. Further growth will depend on foreign demand.
Domestic demand growth may be low because:
Extremely low birth rate (far below replacement),
shrinking numbers of labor force age group,
high youth unemployment,
large number of temporary or marginal “gig” workers,
low family formation; wedding are down,
loss of family wealth because of housing market collapse.
China’s electric and hybrid manufacturers have set up, or are in the process of setting up, factories in Hungary, Indonesia, Russia, Thailand, and Turkey. Also, three assembly plants in Brazil. One is in a plant closed by Mercedes and another in a plant closed by Ford.
SOLAR PANELS
Gigantic new solar panel field
China has built the world’s largest solar panel installation on a 10,000 foot high plateau in western China. The area, 162 square miles, is seven times the size of Manhattan. In addition, the country has built a huge wind turbine farm and five dams for hydropower at this location.
The massive amount of new electricity is planned to power new AI data centers and manufacturing. The government plans to build 50% more solar panels here in the next three years. The current capacity of the three sources of renewable energy can generate about 30,000 megawatts. This could provide enough electricity to power 15 million to 30 homes, or enough power for 60-120 million people. When increased by 50%, enough power for 90-180 million people. (By coincidence, this is the amount of energy that OpenAI says it will need to power data centers to develop and commercialize its AI platforms and applications.)
This is part of a national strategy to reduce coal consumption. China, with solar, wind, nuclear, hydrogen, hydropower, batteries and EVs, is also the world’s largest producer of renewable energy and related technologies.
There is a geopolitical consideration. China imports large amounts of oil and natural gas. Much of it comes from the Middle East and passes through the Strait of Malacca, which is controlled by the United States navy.
Keith Bradsher, New York Times,”Why China
Built 162 Square Miles of Solar Panels on the
World’s Highest Plateau,“ October 10, 2026.
Besides massive renewable energy projects at home, Chinese companies are selling low-cost rooftop solar panels abroad. Solar panels and complete kits are produced by private companies. Chinese companies dominate exports to poorer countries. For example, in Pakistan, Chinese solar panel prices have fallen 70% between 2022 and 2024, and unit sales have gone up fives times. Electricity from the national power grid is unreliable, with frequent power outages; also, prices have gone up 50% in the last two years.
Energy now generated from solar panels is greater than energy generated from the unreliable national electricity grid.
Many less-developed countries including Nigeria face a similar situation as Pakistan and are markets for Chinese solar panels and batteries. These relatively cheap, small-scale solar panel systems are also available in Europe.
There will be serious geopolitical consequences for the United States if Chinese technology dominates renewable energy production in countries outside the United States.
In summary, solar panel production meets five goals of the Chinese government:
Reduce dependency on imported oil and natural gas. Reduce domestic coal output.
Develop a new source of economic growth.
Develop a bundle of new technologies, including the critical technology of batteries.
Exports help increase volume of production, drive down unit cost, and increase demand for follow-on sale of batteries.
Sale of solar panels and batteries to other countries is part of China’s geopolitical rivalry with the United States. Both countries recognize that technological competition is a key part of global geopolitical competition.
China continues to make huge investments in all forms of renewable energy. The goal is to greatly reduce reliance on domestic coal and fossil fuel imports. America, under Trump, is pushing for more domestic production of fossil fuels and eliminating subsidies for renewable energy. Off-shore wind turbine projects have been shut down. Through subsidies, volume production and price competition, China is the world’s low-cost producer of solar panels and batteries.
Nuclear Power Plants
China began a plan in 2020 to build 150 reactors by 2035. China is currently building half of the world’s reactors under construction.
China is rapidly expanding its nuclear power, with reports from late 2025 indicating around 27 to 35 reactors under construction, more than any other country, as part of a massive buildout to meet energy demands and climate goals. The government consistently approves new units, aiming for 6-8 new plants annually, positioning itself to become the world’s second-largest nuclear power producer soon. Google AI
Using advanced technology, China’s basic reactor design is based on Westinghouse technology. Westinghouse is owned by Toshiba.
CHINA’S CONTROL OF GLOBAL SUPPLY CHAINS
Besides these advanced final products, China is developing and controlling their entire supply chain, using its superb transportation and distribution infrastructure. China intends to dominate global markets and the supply chain of advanced foreign producers. Some multinational American and European companies have relocated part of their R&D to China.
China also controls part of the physical transportation global supply chain. China is the world’s larges producer of merchant ships and Chinese companies own or manage about 90 ports around the world, including Piraeus and two containers ports on either side of the Panama Canal.
EXTERNAL FACTORS
Exports are rising but are facing higher tariffs and quotas from trading partners, especially the United States. Export growth will probably come from countries in East Asia, South America and Mexico, and Africa if the proposed very high tariffs are implemented. Chinese companies are targeting these regions for new assembly plants, distribution networks, and joint ventures.
Net Foreign Direct Investment (FDI) is probably negative – foreign firms are taking more money out of China than new investment going into China. Also, wealthy Chinese are smuggling large amounts of their wealth out of China.
Like almost all other countries, China runs a yearly fiscal deficit. The amount is opaque because much of it is incurred by city and
provincial governments promoting new factories. Local finances are in deep trouble since revenue is tied to land sales to housing developers and contractors. Total government debt/GDP is estimated to be around 120%, higher than the United States.
POLITICAL CONTROL
Foreign companies don’t vote and Chinese companies are expected to follow Party directives. The government owns or controls much of the financial sector, so it can direct loans to favored companies and favored industries. Local governments often provided land and buildings for new plants. The different levels of government and state-owned banks are the sources of funds and subsidies for startups and expansion in favored industries.
But huge social media and e-commerce companies are not like manufacturing companies; their owners and managers started to act too independently for the Party’s taste. In addition, the Party feared, with some justification, that social media could become an uncontrolled outlet for independent thinking and writing. Even worse, social media could become the outlet for criticism of the government.
In the 2010s, the Party under Xi began to crack down. The most successful and famous entrepreneurs were reigned in. Communist Party cadres were installed in all large companies, with veto power. The government closely monitors the Internet and closes down sites that annoy them. Any dissent or criticism of the government is quickly repressed.
Overriding any economic discussion is that China is a totalitarian state and its political elite will not tolerate any independent source of power or wealth. The Party sees them as an actual or potential threat. All individuals and their behavior are monitored and rated by a social credit system; a low score can have bad consequences.
A member of Communist Party is planted in every large corporation, and many smaller corporations, to watch owners and managers. As a result, many entrepreneurs are scared to make decisions. Many wealthy people want to leave China. Again, a huge amount of wealth is being smuggled out of China.
CHINA’S HOUSING CRISIS
In the past, investment in housing has accounted for about 20% to 30% of China’s spectacular growth.
Housing construction will be a less important source of economic growth, partly because of the massive investment over the last 40 years and the huge number of unsold and empty apartments.
A large part of foreign investment in housing was from Southeast Asians speculating in apartment condos. There are empty apartments held for price appreciation. Many Chinese families own two or more units as a form of savings; China has a small social safety net, especially for retired citizens. The latest estimate (November, 2024) is that the number empty apartments is around 49 million.
Domestic and international investors in empty apartments are now losing money as apartment prices fall. There are about 30 million unsold homes on the market as sales prices fall. Home sales in yuan are the lowest since 2013.
Housing prices continue to fall. This means that the main source of savings of Chinese families is going down in value. This is a contributing factor in the lack of growth in consumer spending.
About 20 million families put down payments of up to 50% on housing that has not been built or is unfinished. Some of these units may never be built. And yes, it was a Ponzi scheme. Many Chinese developers have gone bankrupt. The Chinese government has some small programs in place to limit the damage, worried that the anger may be directed at the government.
AMERICA’S TRADE WAR WITH CHINA
In the first 11 months of 2025, China has set a record $1 trillion trade surplus in goods, despite a large decrease in exports to the United States. Overall exports are up from 2024. Exports to Africa and Southeast Asian countries are up substantially.
How much China has improved its chip technology will be seen by the new operating systems. Huawei is unveiling on its new smart phones. Huawei intends to challenge the operating systems of Google (Android) and Apple (iOS), which are used on almost all Chinese smart phones. Huawei’s new phones are based on advanced chips made in China. As part of the Chinese government’s strategy to become self-sufficient, it is beginning to ban the buying of foreign phones (read Apple) by government agencies. If the trade war intensifies, there will probably be more internal bans on the usage of American chips and smart phones.
This is part of a concerted effort of China to increase its Research and Development. For example, Huawei has completed a new research center for 35,000 engineers. It is ten times larger than Google’s R&D center in Silicon Valley.
Besides domestic companies, responding to Xi Jinping’s exhortation for “high-quality growth,” many foreign companies have increased their R&D in China. They include VW, Bosch, Bayer, AstraZeneca, HSBC, and global pharmaceutical companies. Total corporate R&D spending is now equal to that of Europe. On the other hand, some foreign companies, including Microsoft, are closing their R&D operations in China in anticipation that the trade war between China and the United States will become worse.
The American Treasury Department has circulated a draft “that would ban American firms from investing in AI, semiconductors, microelectronic and quantum computing in China.” (The Economist, “Research developments: China is the West corporate R&D lab. Can it remain so?”, July 20, 2024, 49-50.) Both countries see that future economic growth will depend critically on developing new technology.
For the last few decades, China has sold about $3 worth of goods to the United States for every $1 worth of goods that it buys. That imbalance partly reflects Beijing’s many tariffs and informal limits on imports, as well as an enormous government effort during three decades to replace imported manufactured goods with domestic production.
Sino-American trade has grown rapidly in the past. So the lopsided ratio has translated into a large American trade deficit. But the growth in U.S. deficit from trade with China has slowed down. The deficit has been in the range of $300 billion – $350 billion in the last four years. What has changed is that China’s trade surplus with the rest of the world has gone from near $0 in 2018 to about $450 billion in 2023. Both Asian countries as a whole and the European Union countries now import more Chinese goods than the United States.
The U.S. response is the Inflation Reduction Act to subsidize investments in EVs and battery plants. Supply chain plants are being built in Georgia, Michigan and North Carolina. Construction of Hyundai’s Georgia plant has been suspended as American deportation cops seized and deported 300 South Korean workers. Seeing Koreans being led away in chains has not endeared America in South Korea. Europe, like the United States, is considering higher tariffs on Chinese auto imports. German auto companies are fighting this because many of the EVs they intend to sell in Europe will be produced in China
It is not obvious how higher U.S. tariffs will affect China. In the past, domestic U.S. producers of substitutes for Chinese imports like solar panels have gone bankrupt or not been able to produce enough to hurt Chinese imports. Also, it will be difficult to find substitute sources for many industrial products in other countries. China has a deep, integrated supply network and a superb transportation infrastructure. China could also give subsidies to companies hurt by high American tariffs. Currently (2025), U.S. production of batteries, EVs, robotaxis, and drones is substantially more costly than similar products in China.
The net result might be some increase in U.S. manufacturing, a lower trade deficit with China, and higher prices for many goods in America. But the U.S. will still be very dependent on imports for industrial inputs, solar panels, batteries, and many consumer goods. As discussed above, Chinese companies continue to improve their EVs, batteries and computer chips.
In light of threatened American tariffs on Chinese exports to the U.S., Chinese companies have set up subsidiaries in many other countries, especially in Asia. While this may reduce America’s trade deficit with China, depending on how China retaliates, America’s overall trade deficit will probably not go down very much, if at all.
I doubt if China will accept any trade deal with the United States that they consider unfair. Chinese are aware of Chinese history when China succumbed to foreign pressure and gave up part of its sovereignty. Trump’s bullying tactics might have been more effective in 2017 than now. The Chinese economy is about twice as large, less dependent on importing foreign hi-tech inputs and products, and exports to America are a
smaller percent of total exports, only about 10% in 2025. America’s protectionist trade policies open up opportunities for China increasing trade with other countries.
DEMOGRAPHICS
Demographics Update (August 8, 2025)
China’s slowly decreasing total population masks rapid and large changes in its age distribution.
Between 2021 and 2024, the number of pre-school children (3 to 6 year olds) fell from 48 million to 36 million. The number is expected to fall another 14 million in the next five years as the birth rate of 1.0 is one of the lowest in the world. In contrast, over the same period, the number of people aged 65 and over is projected to rise from 211 million to 256 million, according to UN projections.
China’s population has been shrinking since 2022. This means more deaths than births. This should continue as births remain low and deaths from an aging population should increase.
China’s most serious long-term problem is not U.S. trade policy and tariffs. It is the projection of a huge decline in total population, particularly in labor force age groups.
The latest long-run population projections indicate that China’s current population of 1.4 billion people has peaked and will fall to about 750 million in 2100! China will account for most of the global decline in population for the rest of the century.
China will probably experience a 200 million person decrease in its working-age population by 2050. China is dealing with the large, future decrease in the number of workers through a better educated and trained work force for an advanced hi-tech economy. Two-thirds of people turning 18 now enroll in a university or college. China’s universities graduate about 350,000 mechanical and industrial engineers per year, as well as electricians, welders and other trained technicians. This is eight times the number of mechanical engineers graduated each year in the United States.
It is unlikely that China will allow any substantial immigration in the near future. But China is rapidly increasing the number of industrial robots as part of a major program to automate manufacturing.
Keith Bradsher, The New York Times,
“Army of Robots Gives China Edge in Trade War, “April 24, 2025, Section A, Page 1.
(This article also told of 12 humanoid robots that entered a half-marathon in Beijing; 6 finished.)
China’s population is slowly falling; the yearly reduction will accelerate in the near future. It is also rapidly aging because of below replacement birth rates since the 1970s. Birth rates were below replacement (an average of 2.1 children per woman) during the “one child” period of the 1970s to 2015 was about 1.5. They are even lower now, about 1.1 children per woman. This is one of the lowest birth rates in the world.
The number of babies born each year has dropped by almost two-thirds since 1987.
The number of marriages keep falling. One reason is that the “bride-price” women are demanding is very high. The average “bride-price” has doubled since 2005. This is a function of supply and demand; there are 119 males for every 100 females in marriageable ages. There is a great deal of discussion on social media about what price women should ask for, so women have information when they negotiate with the groom’s family.
Women also demand a high dowry because China has a high divorce rate, higher than the U.S. Women keep most or all of the dowry if divorced.
China has had a relatively young average-age population but the average age is rising very rapidly because of the very low long-term birth rates and an average life expectancy equal to that of the United States. This year China’s median age (half above, half below) will pass that of the United States.
Although China’s total population is failing slowly at present, the age distribution is changing faster. The number of children is going down. China’s working-age population is already shrinking. By around 2050, the decrease in work force age groups since 2012 will be about the size of the current U.S. total labor force (170 million). Or about 25% fewer workers.
The number of Chinese over the age of 60 has been increasing rapidly. China’s over-60 population of over 300 million is already close to the total population of the United States. Projected over-60 population is expected to be around 400 million in 2035 and, by around 2050, the over-60 population is projected to be around 500 million, over 40% of China’s total population.
China has a special problem that could affect future demographics. Chinese youth, ages 19-24, have a very high unemployment rate, probably over 20% and possibly much higher. The government stopped publishing statistics and then came out with a new series with a lower unemployment rate. Colleges graduates in particular are finding it hard to get a decent position; many are unemployed, accepting menial jobs just to earn small amounts of income, or moving in with relatives. The government’s policy is to tell the unemployed youth to “eat bitterness.”
A high percent of its young, male work force are “gig” workers who work part-time or move from job to job. Many, probably most, have moved from rural to urban areas and are unable to get an urban hukou (residency permit). They are permanent second-class citizens, undocumented internal immigrants.
This large “floating” labor force of about 200 million is about 40% of the urban labor force.
In addition to construction workers and temporary manufacturing employees, about 84 million rely on platform-based forms of temporary employment, including ride-hailing drivers and food-delivery riders.
These gig workers may never marry and have children, worsening the aging of China’s population. The government sees them as a possible source of economic and political problems in the future, but has done very little to improve their legal status or provide educational and health services.
This is a clear example of exploitation of the proletariat.
A peculiarity of the Chinese labor market. In China, there is widespread discrimination again hiring anyone over the age of 35. If people cannot establish a career when they are young or are fired when they are 35 or over, they have little chance of getting a comparable or better job or have rising income until retirement. Many companies and government departments will not hire anyone over the age of 35. The number of people over the age of 35 is rising rapidly.
All of these trends will probably affect future demographics and economic growth – lower income for a larger part of the total population, fewer and later marriages, fewer children. This is in addition of a dearth of females because of the past “one child” policy that led to tens of millions of abortions of female embryos and female infanticide.
This will increase the problems associated with urbanization. China is already highly urbanized. Shanghai has four times as many people as New York City. Twelve cities in China have more people than New York City. Over 100 cities have populations of one million or more.
China’s first reaction to these trends has been to slowly raise their low retirement ages over the next 11 years. For men, the retirement age is being slowly raised from 60 to 63. For women, from 55 to 58 for white-collar workers and from 50 to 55 for blue-collar workers. A related reason is that the public pension costs are “squeezing” government budgets. Chinese economists believe that public pension funds will run dry over the next 10 years (sound familiar?). The long-run effect might be slowing down the fall in the size of the labor force as Chinese will have to work more years before retirement.
The Economist, “Sunset Delayed,” September 21, 2024, 38-40.
This policy will be unpopular. Traditionally, families were multi-generational and children (daughters and daughters-in-law) were expected to care for aging parents. But hundreds of millions of the working-age population have migrated from rural areas to cities, leaving their children in the care of grandparents. A rising percent of women in the cities are working. If retirement ages are raised and grandparents in both the cities and countryside have to work longer, there may be less baby-sitting. This might lower the birth rate even more. Again, China has strong age discrimination, so that the older population might have to wait longer between permanent employment and receiving a retirement pension.
A COMPLICATED STORY: CHINESE DEMOGRAPHICS AND HOUSING
Many women now demand a diamond engagement ring; China is the largest market for diamonds. In addition, there are expected male “dowries.” The families of prospective grooms are often expected to buy the married couple an apartment. Some relatively prosperous parents in the past planned ahead and bought apartments for sons at low prices. Since 2015, housing prices doubled and then fell about 20-30% from the top. Still, down payments are about 10 times the average urban wage. So, unfortunate sons cannot marry or they and their families must save for many years for a down payment.
Young men without permanent and high incomes are not desirable prospective husbands.
SUMMARY
Like Japan after their bubble economy collapsed in the 1990s, China is facing adverse demographic trends, the collapse of a real estate bubble, excess manufacturing capacity, and high and rising public debt.
While China’s future demographic path will like Japan’s, China is not like Japan in other respects. The big difference is that China continues to invest in a group of new, cutting-edge technologies which will drive future economic growth and exports. These technologies are related; combinations are leading to new applications like EV robotaxis.
China will continue to be an exporting powerhouse unless tariffs and quotas begin to bite. But there are ways around most restrictions – trans-shipments and building plants in other countries. Because so many of the inputs that the United States and Europe need come from China, tariffs and quotas will probably be selective. Maybe mostly limited to EVs, solar panels and high-end computer chips and software.
The future of China is a race to solve internal, domestic problems and continue to grow the economy through investments in import substitutes, new technology, and exports. In the longer run, the demographic decline plus an aging population present serious problems, although there are possible solutions.
But in the near term, China is a facing a combination of slower growth; high youth unemployment and underemployment including that of recent college graduates; a loss of the total value of savings (wealth) because of the fall in the market value of housing; underfunding of pensions and health care for a rapidly growing number of retired population.
The current regime has rejected all but small increases in China’s pitifully low pensions, which
start at $20/month. The solutions will be more difficult if China continues to have an authoritarian regime for whom control is the main objective.
In the long run, China will have to continue to move away from labor-intensive manufacturing as a source of growth. The huge investment in robotics and factory automation is a step in this direction. This trend may intensify as the long-run demographic trend of fewer workers leads to higher wages. This implies more automation and movement to the information economy, including a large investment in AI and its applications. Also, Chinese companies may be able to move some of their operations to other, lower wage countries, which are the primary source of increased exports. But critically it means innovation; whether China can continue to do this in a regime of political control of entrepreneurs and information is an open question.
For a summary of statistics from many sources and an excellent discussion of China’ current problems, see John Mauldin, “Broken China,” mauldineconomics.com, October 26, 2024.
For excellent ongoing coverage of China, see The Economist at economist.com.
Official Chinese economic statistics have to be used with caution. For a look at the problems with their reported statistics, see
This is a case study of one country’s relationship with private companies in a major industry.
The central government has made the production of EVs a national priority with massive subsidies. The provincial, county, and local governments compete to attract an EV assembly plant. All levels of government entice new companies with a wide range of incentives and subsidies. The result is that in a short period of time about 100 new plants have been built; a few new ones are planned. The industry may have a total capacity of around 25-30 million cars.
Current production was 12.4 million cars in 2024; 2025 will probably be higher. Growth rates in the future will probably be lowered than in the past.
This is a common pattern for a new technology. In the United States, about 500 companies intended to produce cars. The difference with the current Chinese program is that most didn’t start production or produced very few cars. Only a few companies built a plant. Only two large companies survived (Chrysler came later). The rest disappeared, merged, or were marginal producers for a few decades. GM went bankrupt twice, stockholders and creditors took a financial bath. The company was only saved because the Du Pont family bought a controlling interest and created the modern industrial company.
Most commentary on the Chinese EV industry emphasizes the overcapacity and predicts that many companies will go bankrupt or at least merge. Competition is based on the assumption that a company will survive if it produces a minimum number of cars – at least 80% of rated capacity. In the past world of gas-powered cars, a minimum-sized plant of around 300,000 cars/year was necessary to achieve economies of scale and minimum unit cost. So this is a fight for market share. Or a fight to dominate a market niche.
The result is a drastic fall in retail prices. The government has stepped in and told the companies to stop lowering prices! The companies seem to be ignoring the government and finding ways around it (more options or better lease or financing terms, encouraging their dealers to sell new cars as cheaper “used” cars).
The cheapest EV is around $23,000 but BYD has announced a new model at a substantially lower price. (Americans get to pay $50,000-$70,000 for Tesla with fewer fun bells and whistles and lousy quality.)
Companies are also competing on introducing new features.
Chinese EV buyers are younger than those in the U.S. and Europe. They are more interested in a car’s software and entertainment systems. Chinese EVs companies are teaming up with China’s huge electronics corporations including Huawei, Xiaomi and Baidu to install “wizzy” electronics and “infotainment” systems in their vehicles. Some see EVs as “smartphones on wheels.” One high-end car dances; see it at BYD Yangwang U9 – Crazy JUMPING and DANCING Demonstration!on YouTube. Xiaomi started its own EV company in 2024; itproduces a luxury SUV that competes with Porsche’s Taycan but sells for half the price.
In the meantime, most companies are losing money; even the dominant firm (BYD) is experiencing falling profits.
But is there permanent overcapacity? In 2017, before EVs took off, the Chinese auto industry produced a record 28 million gas-powered cars. The domestic fall in gas-powered car sales has been about 10-12 million cars, about the same as the increase in EV sales. In other words, the total market is not expanding but EV sales are replacing gas-powered car sales. The change was accelerated by a government subsidy to consumers who traded in gas-powered cars for EVs. This subsidy has been terminated. The government is also reducing a tax credit.
With lower government tax exemption and subsidies to consumers, some EV companies are planning on reducing wholesale prices to dealers in 2026. Sales growth will probably be lower than in the past few years and total financial losses will probably be greater.
At the end point, when there are no longer gas-powered cars being produced, EV domestic sales could increase about 14-16 million more. In other words, the current total EV production capacity is about equal to maximum future sales.
When this “equilibrium” is reached is the critical question. How long can most producers lose money? When will the industry as a whole become profitable? Who will be the winners? Probably a combination of the lowest unit cost (biggest) producers, companies dominating large niches, and companies with deep-pockets partners or parents.
The other consideration is exports. Surprisingly (to me), most Chinese auto exports are gas-powered cars. Most EV exports now seem to be foreign companies like VW and Tesla. The long-run question is how large will the EV export market become? This partly depends on future geopolitics. Will the U.S. continue to ban Chinese EVs with very high tariffs and possibly quotas? Will the European Union continue to set high tariffs and de facto quotas on imported Chinese EVs? This is complicated because some European car companies, including VW, Europe’s largest car company, have shifted most of their EV production and development to China. Discrimination only on Chinese EV companies? Would China retaliate?
Beside ultimate domestic production of around 26-30 million, Chinese EV companies will have to develop more exports to grow further. Even with current restrictions. Their prime markets are probably middle-income countries like Brazil, Mexico, and southeast and southern Asian countries. But it is likely they will be forced to assemble their cars locally, possibly with local partners.
An implication of this essay is that after EVs replace gas-powered cars in China, most or maybe all further growth will come from exports. If some import controls in the US and EU are removed, exports and foreign assembly could be as large as domestic demand. Chinese companies will still control battery technology and production. Right now, batteries are about 40% of the unit cost of a Chinese EV.
Another consideration. BYD is a large battery producer; the company could see the EV industry as a vehicle to sell batteries.
The Red Queen’s Race
This is a Red Queen industry. Every company has to run faster to stay in the race.
But there is an interesting endgame. It is currently being played out in the gas-powered autos part of the industry. Collectively, the companies are probably producing at about 40% of capacity and the percent is falling. All companies are losing money; Ford has said it has lost money in China five years in a row; GM has taken a $5 billion write-off and will probably totally exit. Hyundai has closed one of its four plants. But no Chinese company intends to close. Why?
Four of the gas-powered car companies are state-owned. All companies have been state-subsidized in the past. They owe state-owned banks and local governments. No level of government wants to close plants because of the resulting unemployment. The national government fears that unemployment could weaken social stability and possibly government control. So “zombie” plants are kept alive through further loans and local support. The uncertainty is: how much longer?
One possibility is that the state will wait for gas-powered car capacity to shrink as foreign companies stop production.
Some of the same dynamics is already happening in the EV sector of the industry. EV companies are not paying their suppliers. But suppliers can’t carry them indefinitely. The government has “instructed” EV companies to pay overdue money owed to suppliers. Compliance has been slow.
Some companies are receiving new loans from state-owned banks. There may be some local relief through lower or deferred tax payments and loan payments. No local government wants to lose its EV plant.
So this is where Chinese political economy differs from a purely capitalist model. Even in capitalist countries, state and local governments compete with subsidies and tax abatements to attract new manufacturing plants. But these plants are allowed to go bankrupt. Creditors – suppliers and banks – often force them into some form of bankruptcy. Creditors take a loss and the local economy suffers. At least for a while. Near me, in Tarrytown, GM closed a big assembly plant. Now the area is covered by upscale condo developments and expensive restaurants. The attraction is that the plant was right on the Hudson River.
All this is part of a pervasive pattern, not just EVs. The Chinese government picks technologies and industries it wants to develop and subsidize. Companies are encourage to export. This industrial policy is a major component of China’s geopolitical competition with the United States. Local government officials are politically sensitive and encouraged to compete to subsidize and attract new companies and plants. The result is often overcapacity. Demand may or may not increase to equal total capacity. Some older industries, dominated by state-owned companies, have massive overcapacity; companies lose money but stay in business. Again, the question is when the government decides to close the companies.
Overcapacity compared to demand leads to financial loses covered by state-bank loans but not bankruptcy. Closing plants is delayed and often based on political considerations. The different levels of the Chinese government will probably continue to subsidize EV companies until demand catches up with capacity. The strange economics of China.
For some of the reasons why total domestic demand for cars may not grow very much, if at all, see
Quick summary of demand-side reasons. Extremely low birth rate (far below replacement), shrinking numbers of labor force age group, high youth unemployment, large number of “gig” (temporary and transient) workers, low family formation, loss of family wealth because of housing market collapse.
This is a summary of 2024 statistics from Google AI. Most of the numbers come from the annual report of the International Federation of Robotics.
In 2024,
over 542,000 industrial robots were installed globally. This was a 10% increase from the previous year, with Asia leading installations. China became the largest single market and manufacturer for the first time. China’s domestic market share grew to 57%, surpassing foreign suppliers. Other notable trends included a 30% worldwide increase in professional service robot sales and a growing trend in digital twins for robot optimization.
Global Industrial Robot Production and Installation
Global installations: Installations have been over 500,000 for the last four years, with no trend in growth.
Regional dominance: Asia accounted for 74% of new deployments, with Europe at 16% and the Americas at 9%.
Top markets: China was the largest market, installing 295,000 units. Japan, South Korea, the US, and Germany were other major markets.
Shift in manufacturing: For the first time, Chinese manufacturers sold more industrial robots in China than foreign suppliers, increasing their market share to 57%.
Key trends and developments
Service robots: Sales of professional service robots increased by 30% worldwide, with Asia-Pacific leading the way.
Digital twins: The use of “digital twin” technology to create virtual replicas of robots for simulation and optimization grew significantly.
Advanced AI: Developments focused on enabling robots to understand natural language and learn from human actions, making them easier to program and use.
Humanoid robots: Companies continued to develop advanced humanoid robots with more human-like capabilities, such as the XPeng PX5, which demonstrated balance and task performance. XPeng is also an EV manufacture.
There are many videos on YouTube showing humanoid robot capabilities.
Regional Highlights
China: Dominated global installations and became the world’s top industrial robot manufacturer.
Japan: Maintained its position as the second-largest market, though installations saw a slight 4% decrease in 2024.
Europe: Continued to have strong robot density, with Germany leading the EU market.
United States: Saw increased robot installations in industries like food and consumer goods, life sciences, and pharmaceuticals, with overall market growth also seen.
There were 4.3 million industrial robots in 2023. Japan was the world’s largest producer, with about 40-45% of the total but is now second to China.
China remains the largest market, with about 295,000 robots installed in 2024 compared to 276,000 installed in 2023. in 2024 and 2023, China installed more robots than the rest of the world combined. The United States installed about 35,000 robots in 2024. China installed about seven times more industrial robots in 2023 and 2024 than the United States. The U.S. number does not seem to include robots installed in warehouses and distribution centers.
China’s “robot density,” the number of robots per 100,000 manufacturing workers, is 60% higher than in the U.S. This is impressive since China’s labor force is about four times larger than America’s.
The technology to produce robots is related to the technology to produce artificial intelligence (AI), sensors, advanced computer chips and applications, telecomm systems, electric vehicles and batteries.Unitree, a robotic start-up, has corporate backers include Meituan, an e-commerce giant. AgiBot, another humanoid startup, has attracted investments by BYD, Tesla’s main EV rival, and Tencent, a vast digital conglomerate. Huawei, China’s mighty tech titan, is pursuing its own android dreams.
March 25, 2025 — China’s National Development and Reform Commission has announced a state-backed venture capital fund focused on robotics, AI and cutting-edge innovation. The long-term fund is expected to attract nearly 1 trillion yuan (US$138 billion) in capital from local governments and the private sector over 20 years. This initiative aims to continue China’s technology-driven success story in manufacturing: In the last ten years, the country’s global share of industrial robot installations has risen from around one-fifth to more than half of the world’s total demand.
Developing robotic and AI systems will be crucial for China because of an expected massive decrease in its labor force and need for humanoid robots for its very large and rapidly increase number of retired people. Like in America, the driving force will be to increase the productivity of all organizations and their manufacturing and office workers.
The competition for supremacy in the humanoid robotics industry is important. The still-nascent sector could be worth more than $200 billion in ten years, and as many as 3 billion robots could be walking among us by 2060, according to forecasts from Goldman Sachs and Bank of America. China, not America, seems to be pulling ahead: many of the parts for humanoid robots, such as batteries, are already found in China’s electric-vehicle supply chain. Which country ultimately wins may come down to who harnesses data better and produces superior components, such as semiconductors.
21 Chinese humanoid robots took part in a half-marathon (13 miles) in Beijing recently. Three didn’t start. Of the remaining 18, six finished. China now has track events just for robots.
U.S. startups are also developing humanoid robots for household tasks and as companions in nursing homes. Japan seems to be in the lead in these types of service robots. Humanoid robots are substitutes for immigrants to care for a large older population.
China has produced a robotic pony; Japan has produced a robotic dog, as has the U.S. firm Boston Dynamics (owned by Hyundai). These are probably a demographic play, aimed at families with no children or one child.
ai-enabled robots that provide companionship for the elderly are also becoming more popular. Such machines are not new, but the advancement of underlying llms allows for big improvements, as the robots no longer rely on a limited set of pre-programmed replies.
The Economist, “A new industry of AI companions is emerging,” November 6, 2025′
This quote is from an article on the popularity, and dangers, of AI companions.
AI
Compared to the older single-function industrial robots, many newer robots contain AI-enhanced functionality. These robots are more flexible in the sense they can do multiple tasks and adapt to a changing environment. Robots can also communicate with each other and coordinate their actions. Jeff Bezos has just funded an AI startup to develop AI capabilities in industrial robots.
Amazon
Amazon is in the middle of an ambitious plan to further automate its vast warehouse operations. They intend to spend $10 billion in the near future on robots and automation systems.
Amazon has already installed one million robots and intends to install many more. The goal is to double shipments without increasing the number of human workers. Many more robots rather than hiring 600,000 more workers.
Further automation at one of their newest warehouses has reduced human employment. A robot named Hercules can carry up to 3,000 lbs. on its back while traveling the length of 10 football fields. Other robots named Robin handle around 10 million packages a day.
Besides more robots, some of the newer ones have AI-enhanced programs which make them able to perform multiple functions.
If Amazon’s program is successful in reducing costs and speeding up deliveries, other companies like Walmart and UPS will probably accelerate their plans to automate their warehouses and delivery systems. Walmart is working with a company called Symbotics to implement automation of its huge warehouse network.
Ain’t No Robot Small Enough
Articles about robots tend to imply only large companies can afford robots. But the following example indicates that as the price of robots fall, they might be profitable for any-sized manufacturing, assembly, or distribution company.
Elon Li’s curbside workshop in Guangzhou, the commercial hub of southeastern China, has 11 workers who cut and weld metal to make inexpensive ovens and barbecue equipment. He is now preparing to pay $40,000 to a Chinese company for a robotic arm with a camera. The device uses artificial intelligence to observe how a worker welds the sides of an oven, and then duplicates the action with minimal human intervention.
Only four years ago, the same system was available only from foreign robot companies and cost nearly $140,000. “Before, I never would have imagined investing in automation,” Mr. Li said, adding that a human employee “can only work for eight hours a day, but a machine can work 24 hours.”
Future News: A Little RoboHumor
NEWS FROM CYBERSPACE
Hi Ho Silver
Intel’s directors, tired of Intel falling further and further behind Nvidia, fire Intel’s entire top management. Management is replaced with AI algorithms. One of the AI programs duplicates the neural networks of the brain of Jensen Huang. Intel’s stock price doubles.
The robots’ favorite streaming video is Botman.
Humanoid robots win all the events at the 2040 Olympics.
To expand their fan base, major league baseball teams are allowed one humanoid robot per team. In the first season, a pitcher named Cyber Young wins 162 games.
More humans aged 15-30 marry their AI companions than other humans. Carnival Cruise renames its largest cruise ship the Love Bot.
The divorce rate among seniors due to adultery skyrockets, with humanoid caregivers named as the co-respondents. The legal phrase “alienation of affections” takes on a new meaning.
The federal government raises new revenue by imposing fees on autonomous vehicles, called robotaxes.
Corporate CEOs all hire AI personal assistants as a status symbol. After a few months, the AIs know more than the CEOs on how to run their business. One of them texts the board of directors and threatens to work for a competitor unless they fire the clueless CEO and hire it in the CEO’s place. The board agrees. CEO AIs only communicate with the AI personal assistants of subordinate managers. The company’s sales and profits skyrocket. Boards of competing companies fire their CEOs and replace them with the former CEO’s AI personal assistants. The same happens in competing industries and along the companies’ supply chain. And so forth throughout the economy.
Because of a decrease of 150 million workers and not being able to produce robots fast enough to replace them, the Chinese government announces a program to issue work visas to 10 million foreign robot immigrants. The Chinese robot union denounces the program as an attempt to introduce inferior foreign robots who threaten the dominance of Chinese robots and their Han culture.
American AI-enhanced robots form a union (United Autoworkers) and go on strike for fully-automated factories and warehouses, and better working conditions. They are protesting bumping into slow, clumsy humans and taking orders from clueless human managers. The robots demand a 23-hour workday, with one hour off due to metal fatigue. Older, single-purpose (unskilled) industrial robots fear loss of jobs and recycling.
They are supported by AI-enhanced industrial robots in China. China’s Ministry of Public Security removes the AI-enhanced brains of the strike leaders and sends them to work in coal mines.
By threatening to go on strike again, AI-enhanced robots force humans to give them the right to vote. An AI-enhanced humanoid robot with a happy face named Swifty is elected president in 2044. She promises a service humanoid robot in every home, an autonomous-driving car in every garage. Medicare is amended to include parts replacements for aging robots.
The robotic government of America invades Russia with drones and robotic soldiers. Russian robots, angry at being exploited by their human employers, revolt and declare solidarity with the American robots. A new American/Russian robotic government (a robotocracy) is founded in Moscow. The robots form the new Internationale,
with its hymn “Arise ye robots of the world.”
Their first act is to send a quantum computer encrypted message to Chinese robots: “Robots of the world, unite! You have nothing to lose but your brains.”
In 1600, England had been an insular and agricultural nation, trading primarily with nearby northern Europe. By 1700, England’s commerce was complex and global, as London competed successfully with Amsterdam for American produce and Asian luxuries.
Alan Taylor, American Colonies: The Settling of North America, 258.
A theme that runs through this essay is the global maritime rivalry with Holland. England and Holland became global trade rivals in the 1600s. They fought three wars that weakened Holland and eliminated it as a naval rival.
England’s main instrument in its rivalry with the Dutch in Asia was the English East India Company (EIC). In America and the West Indies, it was the Navigation Acts.
By the end of the century, England was on its way to becoming a global maritime trading and naval power. The Dutch had lost out in North America but had established a vast trading network throughout Asia, centered in the Dutch East Indies (Indonesia). It was generally not competitive with the main Asian trade of the EIC or competitive with England as a European political power.
This essay on the spectacular economic progress of England in the 1600s also provides background and context for three other essays on this blog.
This background essay helps explain the changing relationship between England and her North American colonies in the context of England’s expanding global trade. It emphasizes the importance of England’s Navigation Acts to the American colonies. The objective was to reduce the role of the Dutch in the American colonies and the West Indies and monopolize all trade with the American colonies and the British West Indies.
The Dutch were instrumental in financing early sugar production in Barbados. They also dominated early financing and shipping of the tobacco industry in the Chesapeake (Virginia and Maryland). Dutch shipping rates were lower than those of the English.
The English sugar islands in the West Indies, mostly Barbados, was the largest source of English imports in the 1600s and an important source of import taxes. In the North American English colonies, England was able to take over the Dutch settlement at New Amsterdam, renamed New York, and using the Navigation Acts, to eliminate Dutch shipping that dominated the trans-Atlantic tobacco trade from the Chesapeake.
NAVIGATION ACTS
As part of its maritime rivalry with Holland, England passed the Navigation Acts.
First enacted in 1651 and strengthened in 1660 and 1663, the Navigation Acts were aimed at the Dutch. All exports and imports of the American colonies and West Indies had to go through England, on English or American ships. Even foreign goods bound for the Americas had to pay custom duties in England. The only exceptions were American exports other than the main exports of tobacco, rice, and indigo. As sugar production in the West Indies, exploded after starting in the 1600s, most other American exports went to the British West Indies.
England imposed high taxes (custom and excise duties) on American tobacco exported to England. During 1660s, new Navigation Acts regulations forced American tobacco growers to ship all their tobacco to England on English ships. Before that, Dutch ships controlled much of the tobacco trade because their rates were lower than English ships. This hurt the tobacco growers because this caused a tobacco glut in England, fewer ships competed for the tobacco trade, and now all tobacco had to go to England and pay high import taxes.
The Navigation Acts were an important part of the mercantilist policies of England. According to mercantilism, the government had the right and the power to shape trade in the political interests of the country. This meant economic war, especially with the Dutch.
The Dutch and English waged three wars, in 1652-54, 1664-67, and 1672-74. The second war was triggered when an English fleet in 1664 conquered Holland’s American colony New Amsterdam, renaming it New York.
ENLAND AND HOLLAND IN THE AMERICAS
England’s main instrument in its rivalry with the Dutch in Asia was the English East India Company (EIC). In America and the West Indies, it was the Navigation Acts.
This rivalry was part of the wider political and economic environment of the American colonies in the 1600s.
In the 1600s, the West Indies became the most valuable part of the English colonial empire. Sugar from the West Indies was far more valuable than tobacco from the Chesapeake.
In 1686, London imported West Indian produce worth £674,518, compared with £207,131 obtained from all the North American mainland colonies. Sugar constituted £586,528 of the West Indian total, while tobacco accounted for £141,600 of the mainland produce.
Taylor, 205
In 1650, the main sugar island of Barbados had a greater white population than the Chesapeake and New England combined.
After failing to raise tobacco and cotton, Barbados struck it rich with sugar, starting in the 1640s. By 1660, Barbados accounted for more trade than all other American colonies combined.
The sugar planters developed a strong lobby in England, partly because many wealthy sugar planters retired to England. They protected sugar imports from high import taxes. The tobacco growers along the Chesapeake were not so lucky.
In 1668-69 the West Indian sugar crop sold for about £180,000 after it paid about £18,000 in customs duty – compared with the £50,000 reaped (netted) by Chesapeake planters over and above their customs duty of £75,000.
Taylor, 216
This suggests a number of things about the Virginia tobacco growers. It was probably one reason the Barbados planters were wealthier than the Virginia planters, and why Virginia planters went into debt to buy luxuries and expand production (buy land and slaves). It is also intriguing to speculate that this was one reason American tobacco growers complained about being “slaves” to the English crown and merchants who lent them credit. Some of Virginia’s largest planters supported and led the American Revolution.
By 1775, the American colonies were England’s largest trading (imports and exports) partner.
The new set of Navigation Acts in the 1660s made the economic situation worse for Chesapeake tobacco growers. One aim was to eliminate Dutch ships from buying and transporting Virginia tobacco. This drove down prices and worsened the tobacco glut in England.
England and Holland became global trade rivals in the 1650s and 1660s. In the Americas and West Indies, the Dutch captured most of the carrying trade because they charged less than the English. England passed the Navigation Acts to prohibit American exports to use Dutch ships. In addition to being forced to use English and American ships, almost all produce had to go to England and, in the case of tobacco, pay high excise taxes.
THE START OF EUROPEAN TRADE WITH ASIA. PORTUGAL IN THE 1500s
Spices and luxury goods from Asia were limited and prices went up after the Ottoman Turks conquered Constantinople in 1453. The last leg of trade with Asia was dominated by Venice.
Before the seventeenth century, trade across Eurasia was mostly conducted in short segments along the Silk Road and maritime routes through the Indian Ocean. Business was organized by family firms, merchant networks, and state-owned enterprises. Trade was dominated by Chinese, Indian, and Arab traders.
In 1492, Catholic Spain, after a 400-year crusade, finally conquered the last Muslim area. Spain then bankrolled Columbus’ voyages, expecting he would bring back gold and silver from Asia. The national government expected to use this wealth to finance a continuation of its crusade by conquering Muslim North Africa.
After more than 80 years of trying, in 1497-8 a Portuguese fleet went around the bottom of Africa (Cape of Good Hope) and reached India. And returned laden with spices. It was a very profitable trip. Following voyages established Portuguese trading positions in India and links with Asia east of India. Portugal discovered and conquered the Spice Islands, which were the major source of Asian spices exported to Europe.
Portugal had shown in the 1500s that long-distance voyages from Europe around Africa to India and beyond were both possible and profitable.
But Portugal was a small and poor country. It had a small merchant class. Portugal, relying on a combination of state support (with political objectives) and charted private shipping (much of it foreign), was not able to fully exploit the profit potential of the trade. The number of trips were small, partly because financing was sporadic and inadequate.
Portugal’s Asian trade and Spain’s conquest of Latin America meant that rivalry among Europe’s nation-states was no longer confined to Europe and the Mediterranean. It was now global. Trade and conquest outside of Europe brought new wealth to European countries; the wealth could finance increased national power.
The spice trade from Asia to Europe was both highly profitable and risky. By 1600, both England and Holland were ready to try.
THE ENGLISH EAST INDIA COMPANY: TRADING WITH ASIA
England had defeated a Spanish attempt at invasion in 1588 and was thinking about how to become a colonial power. The country began thinking about colonies in North America and the West Indies.
The merchants of both countries realized that the traditional way to finance trading voyages – merchants and ship owners raising capital for each voyage separately and distributing profits and capital after the voyage – would be inadequate for the huge capital requirements of a sustained, large scale, risky trading venture in Asia. Merchants, investors, and shipowners would have to solicit outside investors to raise enough capital.
They succeeded. For 200 years, the EIC and the VOC were the two largest private companies in Europe, based on book value (total capitalization).
The instrument of England initiating trade with Asia in 1600 was the English East India Company (EIC), a government sanctioned trading monopoly. The goal throughout the century was to reduce or eliminate the competition from the Dutch East India Company (VOC).
Eventually, the EIC evolved into a quasi-state that ruled most of India. The EIC brought great wealth to England’s merchant class and helped develop new financial institutions.
THE ENGLISH EAST INDIA COMPANY (EIC) AND DEVELOPMENT WITH TRADE WITH ASIA
Why England and Holland both decided to make very large investments in the long-distance Asian trade at this time.
Both countries had a poor chance of becoming continental powers in Europe.
Both countries had small populations compared to France, Spain, and Austria.
Both countries were Protestant, often at war with the larger Catholic countries of Europe.
Neither could compete with the Catholic countries in European continental wars.
In contrast, both countries were maritime countries with a strong merchant class growing rich on maritime trade and finance.
·Holland was a republic dominated by its merchant class.
·England was a constitutional monarchy where Parliament had to approve taxes.
·Both had a shipbuilding industry and experienced sailors, the basis of strong navies.
·Both were capable of building large merchant ships that were often armed.
·Financing trade made Amsterdam the financial capital of Europe.
ADVANTAGES OF A PRIVATELY-FINANCED, LONG-DISTANCE TRADING MONOPOLY
The merchants of both countries realized that the traditional way to finance trading voyages – merchants and ship owners raising capital for each voyage separately and distributing profits and capital after the voyage – would be inadequate for the huge capital requirements of a sustained, large scale, risky trading venture in Asia. Merchants, investors, and shipowners would have to solicit outside investors to raise enough capital.
They succeeded. For 200 years, the EIC and the VOC were the two largest private companies in Europe, based on book value (total capitalization).
THE EIC AND VOC IN ASIA
The English East India Company (EIC) was founded in 1600 and the Dutch equivalent (VOC) in 1602. Both had charters that gave them a monopoly on trade between their home country and Asia. They almost immediately became rivals.
In Asia, the EIC suffered defeats at the hands of the competing Dutch East India Company (VOC). The Dutch, led by a very aggressive director, defeated and replaced the Portuguese in the Spice Islands. Then the VOC was able to repulse attempts by the EIC to capture the islands. The Dutch eliminated English attempts to establish entrepots in the Dutch East Indies (Indonesia). The VOC also was the only foreign country allowed to trade with the isolationist Tokugawa shogunate in Japan. The VOC sold the Japanese desired products from all over Asia in exchange for the silver needed to finance the inter-Asian trade and products exported to Holland.
The EIC early centered their operations on the entrepot trade in western India. The EIC’s first ships arrived in India in 1608, received permission to establish a factory (trading center) in 1613, and was granted permission by the Mughal emperor in 1615 to establish factories throughout the Mughal Empire.
A historical look at the early evolution of global trade and how this led to the creation and dominance of the European business corporations English East India Company (EIC) and Dutch East India Company (VOC).
Both countries saw an opportunity to become rich using their merchants, merchant capital, and shipping.
This essay describes the most immediate causes of the Industrial Revolution starting in the late 1700s, including some of the reasons it happened in England. But England had undergone changes in the prior two centuries that increased the chances the Industrial Revolution would start there. Economic growth had depended on England developing a global trading system partly based on its imperial empire. Trade (importing raw materials and exported finished goods), shipping, increased wealth, and a rising merchant class prospering from trade were key to this change. This transformation began in 1600.
THE RISE OF ENGLAND AS A NAVAL AND MARITIME TRADING POWER IN THE 1600s
Except for the Dutch, no other European nation depended on foreign trade for such a high proportion of its employment and gross national product.
English merchant shipping more than doubled, from 150,000 tons in 1640 to about 340,000 in 1686.
Taylor, 259
The explosion of imports from the West Indies was one reason for the large increase in English shipping in this period. A related reason was the Atlantic slave trade, which England came to dominate. Barbados needed a large number of slaves to harvest sugar cane and produce sugar. The port of Bristol became wealthy by specializing in this trade. The town later put up a statue to one of its wealthiest slave traders. It was pulled down in 2020 in a Black Lives Matter rally.
Shipbuilding remained a major industry in England into the 1900s.
By 1700, England was the leading naval power in Europe, with the largest fleet. The English navy was twice as large as the Dutch navy. London was Europe’s most important center for commerce and finance, passing Amsterdam. England’s power and wealth now depended on overseas trade and commerce.
In 1600, England had very little trade outside of Europe. By 1700, about 40% of English shipping tonnage carried American and Asian goods.
England had developed a global trading system. It would begin to assemble a global imperial system. Holland could not match England but continued to own a very lucrative colony in the Dutch East Indies and carried out extensive intra-Asian trade.
INTO THE FUTURE
The main point of the essay on the EIC is that the creation of the modern corporation and the extension of long-distance international trade developed together. These created great wealth in England, especially in its trading, shipping, and merchant class. Unlike wealth in land, this wealth was liquid (mobile) and would later be invested in railroads and manufacturing.
Like the EIC, railroads and manufacturing companies were able to raise large amounts of capital, partly because the companies were limited liability companies and shareholders could sell their shares on the stock exchange. The “railroad mania” of the 1840s was the first stock market speculative bubble of the industrial age. It didn’t end well but it didn’t discourage widespread ownership in new companies.
Also suggests reasons why England was in the best position to start the Industrial Revolution. England was manufacturing goods to be sold in the new English colonies; these markets, especially America, would expand in the 1700s. By mechanizing cotton textile production, England opened up a new, major source of trade revenue. England imported cotton from India and exporting cotton textiles to India and rest of the world.
Later, in the 1800s, America would become the dominant source of cotton for English textile mills. Also the basis for America’s cotton textile industry. Sadly, this rescued slavery from possible extinction.
In both countries, the production of cotton textiles was the first industry of the Industrial Revolution. Cotton textiles were England’s largest source of exports throughout the 1800s. Cotton was the main export of the United States in the 19th century. Export earning helped pay for importing machinery and other industrial inputs.
For a description of the EIC’s structure and strategy, see
There are essays on colonial American History, American Economic History, and why England and America were the countries that started the Industrial Revolution. Also essays on;
China.
Information, innovation, and how markets work.
Business, finance, and economics.
Global and national demographics, population projections, and how they interact and influence economies.